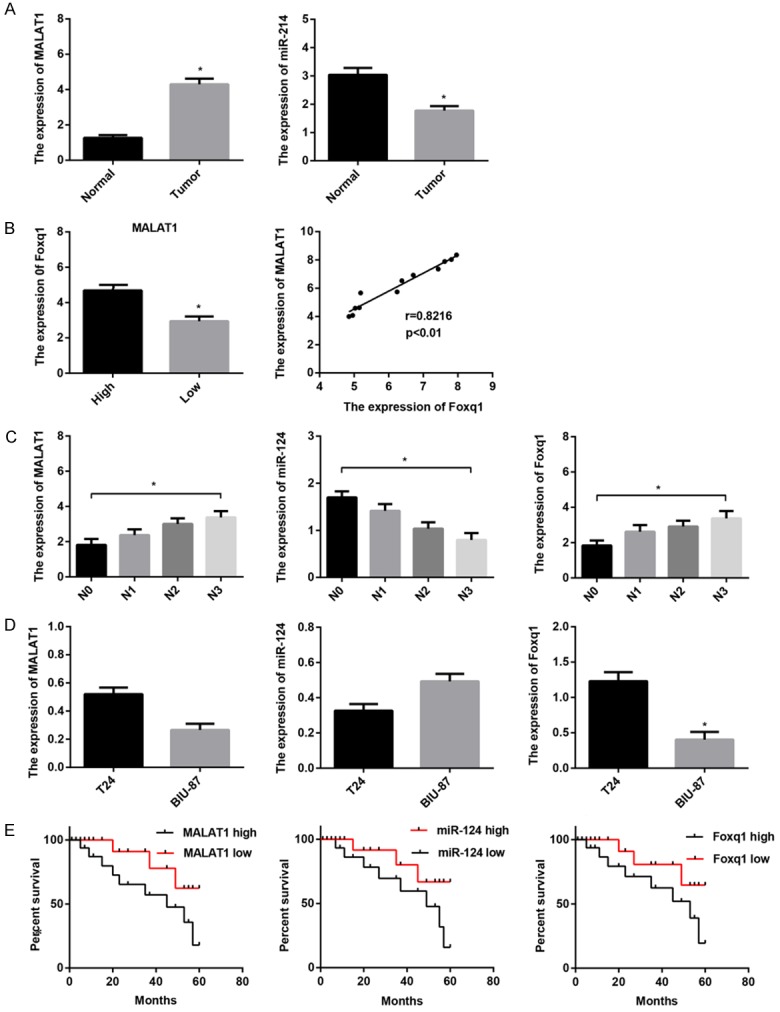
Figure 1.

Expression of MALAT1, miR-124, foxq1 in BTCC. The relative expression was examined using real-time PCR in 56 patients with BTCC and 2 BTCC cell lines. Data are shown as mean ± SEM. A. MALAT1 was up-regulated in 56 tumor tissues compared with surrounding normal mucosa tissues; miR-124 was down-regulated in tumor tissues in comparison with matched normal mucosa tissues. B. MALAT1 and foxq1 were positively expressed in BTCC. C. MALAT1 and foxq1 expression positively correlated with BTCC clinical pathological stage; miR-124 expression inversely correlated with clinical pathological stage. D. MALAT1 and foxq1 were more abundant and miR-124 was weaker in T24 cells than BIU-87 cells. E. Kaplan-Meier survival curves revealed that patients with high levels of MALAT1 and foxq1, or weak levels of miR-124 exhibited an unfavorable clinical outcome. Patients were divided into MALAT1-high/low group; miR-124-high/low group; foxq1-high/low group based on the median of their expression in BTCC, respectively. *P < 0.05.
