
Figure 12.
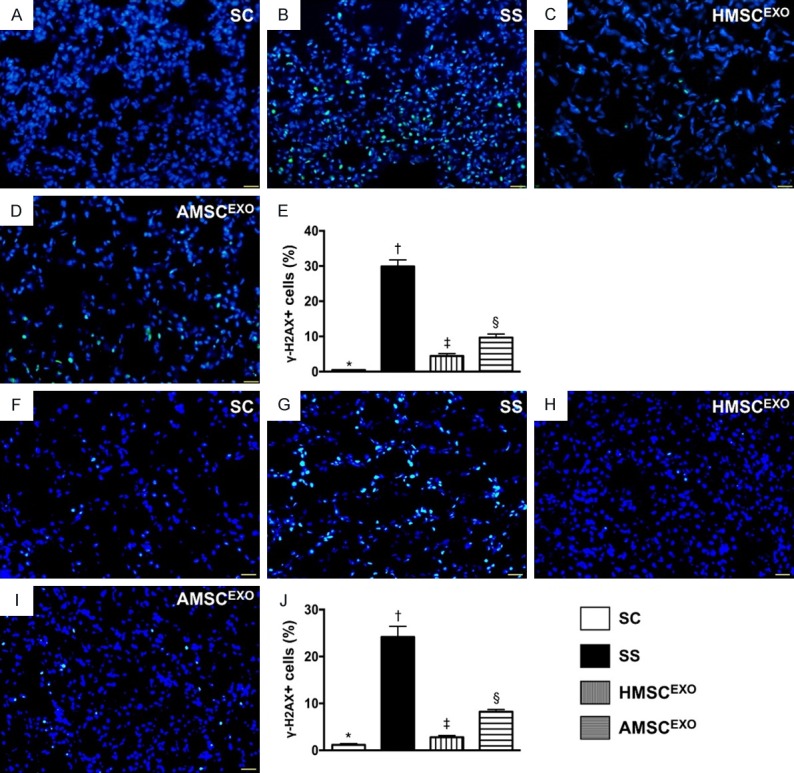
Cellular expression of DNA-damage marker in lung and kidney organs at day 5 after SS induction. A-D: Immunofluorescence (IF) microscopic findings (400) for identification of γ-H2AX+ cells (green color) in lung parenchyma. E: Analytical results of number of γ-H2AX+ cells, * vs. other groups with different symbols (†, ‡, §), P < 0.0001. F-I: IF microscopic findings (400×) for identification of γ-H2AX+ cells (green color) in kidney parenchyma. J: Analytical results of number of γ-H2AX+ cells, * vs. other groups with different symbols (†, ‡, §), P < 0.0001. Scale bars in right lower corner represent 20 µm. All statistical analyses were performed by one-way ANOVA, followed by Bonferroni multiple comparison post hoc test (n = 6 for each group). Symbols (*, †, ‡, §) indicate significance at the 0.05 level. SC = sham control; SS = sepsis syndrome; AMSCEXO = apoptotic adipose-derived mesenchymal stem cell-derived exosomes; HMSCEXO = healthy adipose-derived mesenchymal stem cell-derived exosomes.