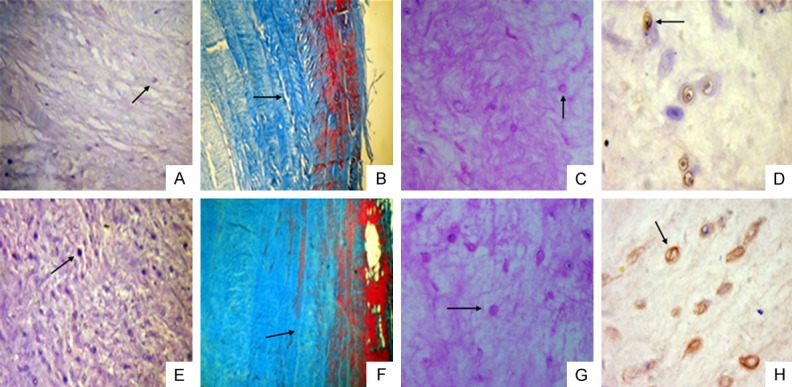
Figure 3.

Histological and immunohistochemical staining of the intervertebral disc at 12 weeks post-puncture in the rhesus monkey model of disc degeneration and normal disc. A. H&E staining shows a decreased number of NP cells (indicated by the arrow) at 12 weeks post-puncture (×10). B. Masson staining of the annulus fibrosus indicates that widening of the fibrous cracks (indicated by the arrow) between annulus fibrosi occurred at 12 weeks post-puncture (×40). C. Safranin-O staining indicates sparse positive cells (indicated by the arrow) of the NP for aggrecans at 12 weeks post-puncture (×20). D. Immunohistochemical staining for type II collagen indicates a decreased number of positive cells (indicated by the arrow) at 12 weeks post-puncture (×40). E. H&E staining of the normal disc shows a large number of NP cells (indicated by the arrow) (×10). F. Masson staining of the normal disc shows no apparent fibrous cracks (indicated by the arrow) between fibrous rings in the annulus fibrosus (×40). G. Safranin-O staining of the normal disc indicates more positive cells (indicated by the arrow) (×20). H. Immunohistochemical staining of the normal disc indicates a large number of positive cells (indicated by the arrow) (×40).
