Figure 6.

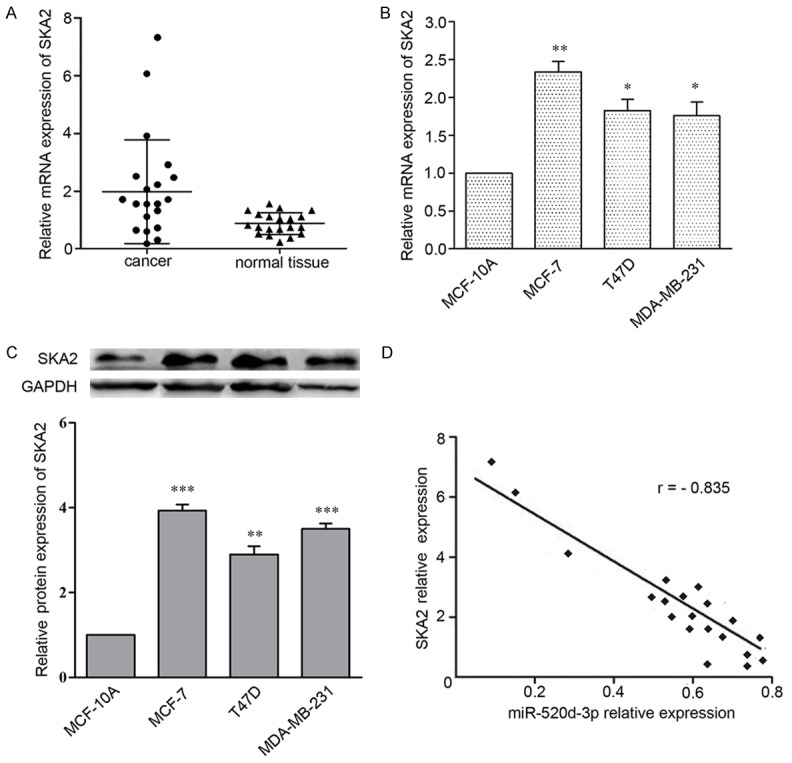
Statistical correlation between the expression levels of miR-520d-3p and SKA2 protein in breast cancer tissues. A. qRT-PCR analysis of SKA2 expression in 20 human breast cancer tissues compared with their matched adjacent non-tumor tissues. B, C. Western blot and qRT-PCR analysis of miR-520d-3p expression in three human breast cancer cell lines and a normal human breast epithelial cell line. Data were shown as mean ± SD from three independent experiments. *P < 0.05, **P < 0.01, ***P < 0.001 versus MCF-10A cell. D. The inverse correlation in breast cancer tissues was analyzed by Pearson’s correlation method.
