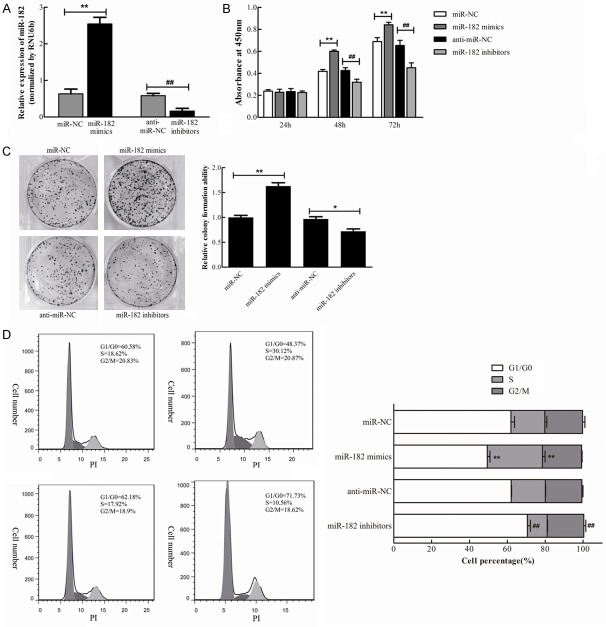
Figure 3.
miR-182 promotes NSCLC cells proliferation. miR-182 mimics, miR-182 inhibitors, and corresponding negative controls were transfected into H460 cells individually. A. miR-182 level was determined by qRT-PCR 48 h after transfection. B. The effect of miR-182 overexpression and down-regulation on cell growth was determined by CCK-8 reagent at 24 h, 48 h, and 72 h after transfection. C. Representative micrographs of crystal violet stained colonies formed by four groups of H460 cells. D. The effect of miR-182 on cell cycle progression of H460 cells analyzed by flow cytometry and quantification of cell percentages in G0-G1, S, and G2-M phase. **P<0.01 vs. miR-NC, ##P<0.01 vs. anti-miR-NC.

