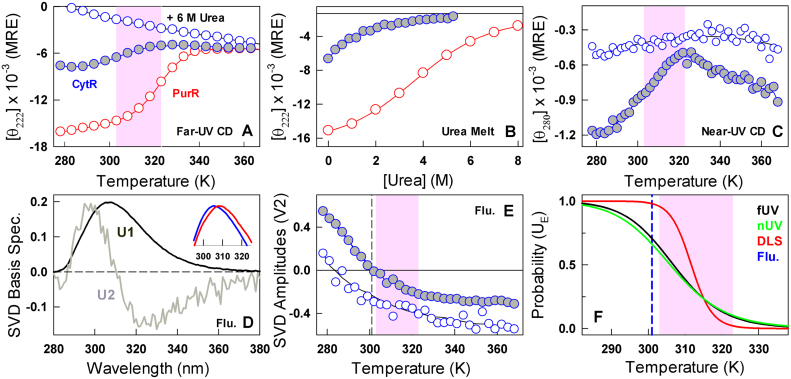
Figure 2.
Multi-probe characterization of CytR conformational changes. Filled and open blue circles are CytR in 43 mM ionic strength conditions and 6 M urea (both at pH 7.0), respectively. Red circle represents PurR at pH 7.0, 43 mM ionic strength conditions. Shaded areas highlight the collapse transition regime in CytR. (A) Temperature dependent changes in secondary-structure reported in mean residue ellipticity (MRE) units of deg. cm2 dmol−1. (B) Urea melts at 298 K highlighting the differences in the unfolding patterns of disordered CytR and folded PurR, respectively. (C) Changes in the tertiary structural environment monitored by near-UV CD of Y53 at 280 nm. (D) Basis spectra from a global singular value decomposition (SVD) of temperature-wavelength fluorescence emission of CytR in both 43 mM buffer and 6 M urea conditions. The first component reports on the average spectrum (U1) while the second component (U2) represents the red shift of the emission profile. Inset: normalized emission spectra of CytR at 278 K (blue) and 350 K (red) at 43 mM buffer, pH 7.0. (E) Amplitudes (V2) of the second basis spectrum shown in panel D. The vertical dashed line reports on a spectral sign change beyond which emission broadening dominates the observed spectrum. (F) Apparent probabilities of expanded coil conformations (UE) as a function of temperature from a two-state analysis of the observed far-UV CD (black), near-UV CD (green) and DLS (red) transitions. The inflection point for the tyrosine red shift is shown in blue.

