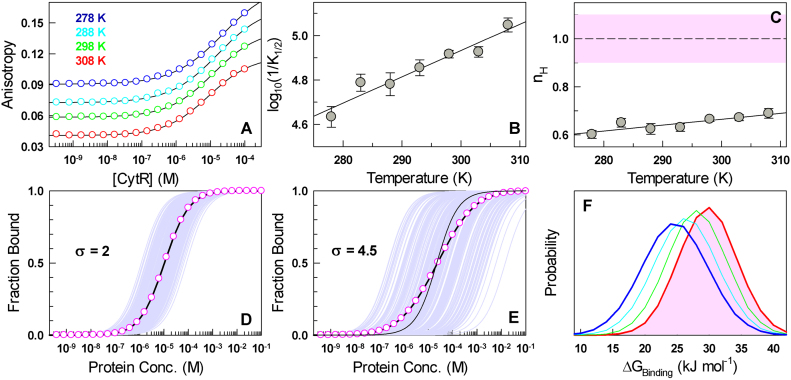
Figure 5.
Binding heterogeneity explains negative cooperativity in 1:1 binding. (A) Anisotropy of dye-conjugated DNA as a function of CytR concentration at different temperatures (circles). Black curves are from fits to the Hill equation. (B) The apparent binding affinity (1/K1/2) as a function of temperature. The line is shown to guide the eye. (C) The Hill coefficients (nH) as a function of temperature together with the nH range expected for 1:1 binding in the shaded area. (D) The case of an apparent 1:1 binding simulated for 1000 molecules (light purple) for σ = 2 kJ mol−1, i.e. minimal binding heterogeneity. The mean binding isotherm is shown in circles together with a 1:1 fit (black curve). (E) Same as panel D but for σ = 4.5 kJ mol−1 corresponding to a scenario with substantial binding heterogeneity. The thin black curve is the shape of the isotherm expected for 1:1 binding without any heterogeneity in binding free energies. (F) Distribution of binding free energies in an ensemble of 1000 molecules derived from the heterogeneity analysis (see main text) for the temperatures shown in panel A.

