Figure 3.
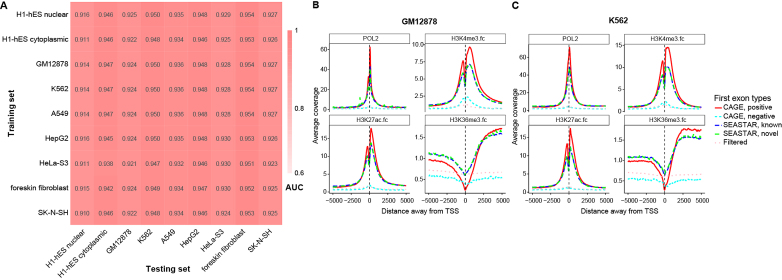
Identification and features of FEs across multiple cell types. (A) The area under the curve (AUC) values of the ROC curves for nine different conditions (whole-cell data of the GM12878, K562, A549, HepG2, HeLa-S3, foreskin fibroblast and SK-N-SH samples, and both the nuclear and cytoplasmic fractions of the H1-hES cell line). To test the robustness of our logistic regression model for identifying FEs in different cell types, we tested the logistic regression model on each cell type using the parameters trained from each of the other cell types. The lowest AUC was 0.910 and the average AUC was 0.936. These results suggest that the logistic regression model was robust for different cell types, and the model parameters were not over-fitted to specific cell types. (B and C) The distributions of RNA POL2, H3K4me3, H3K27ac and H3K36me3 signals around the TSSs of different sets of FEs in the GM12878 cell line (B) and the K562 cell line (C). RNA POL2, H3K4me3 and H3K27ac are shown to be enriched around reference positive CAGE TSSs and SEASTAR FEs (known and novel). H3K36me3 is shown to be enriched downstream of reference positive CAGE TSSs and SEASTAR FEs. Reference negative CAGE TSSs and putative FEs filtered by SEASTAR show no such enrichment patterns.

