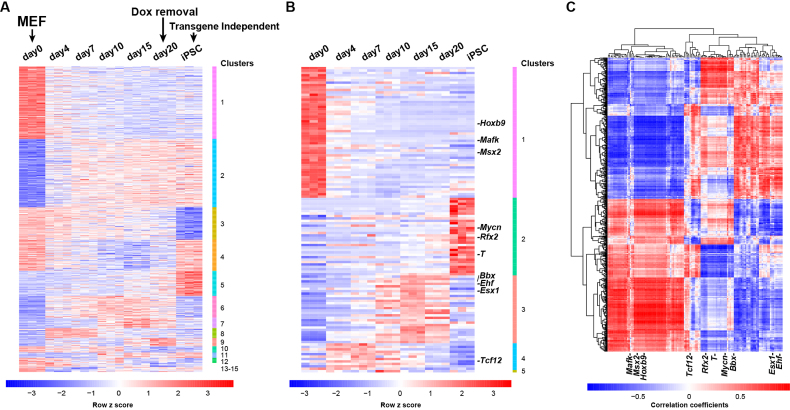
Figure 5.
Genome-wide analysis of differential AFEs and associated TFs during iPSC reprogramming. (A) Heatmap of genome-wide AFE usage levels (PSI values) during iPSC reprogramming (3 replicates for each time point). AFEs were clustered into 15 groups of distinct temporal patterns. (B) Heatmap of expression levels of 126 TFs with temporal expression changes during iPSC reprogramming. The TFs were clustered into 5 groups of distinct temporal patterns. The top 10 TFs ranked by the enrichment analysis are highlighted. (C) Heatmap of Pearson Correlation Coefficients of AFE PSI values and TF expression levels across the time course. Each row represents an AFE and each column represents a TF. The top 10 TFs ranked by the enrichment analysis are highlighted.

