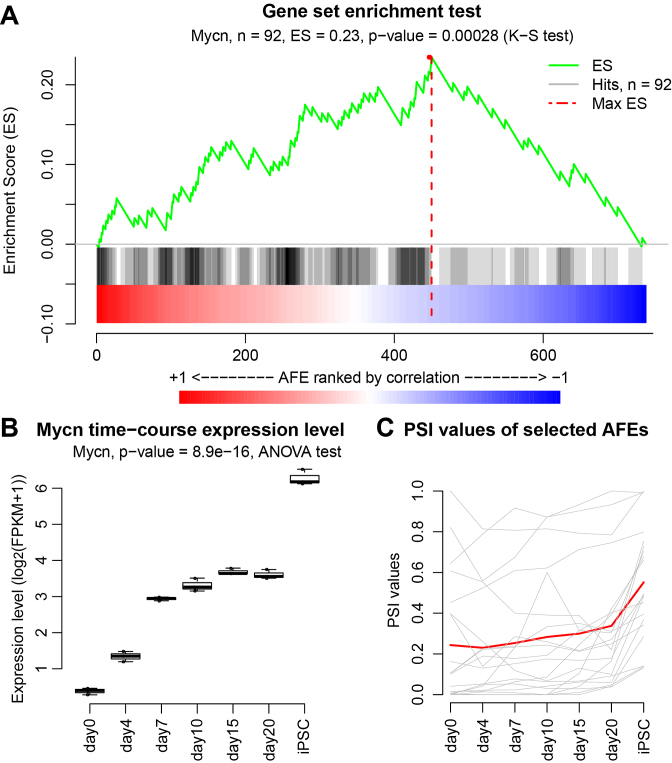
Figure 6.
N-Myc (Mycn) as a potential driver of differential AFEs during iPSC reprogramming. (A) The gene set enrichment analysis (GSEA) like plot for N-Myc (Mycn). Differential AFEs were ranked based on the correlation of their PSI values to Mycn expression levels during the time course. Differential AFEs containing the Mycn motif were significantly enriched towards the top of the list. (B) The expression levels of Mycn across the time course. (C) The PSI values of Mycn-associated AFEs across the time course. The PSI value of each individual AFE is drawn in gray and the red curve represents the average of all AFEs.

