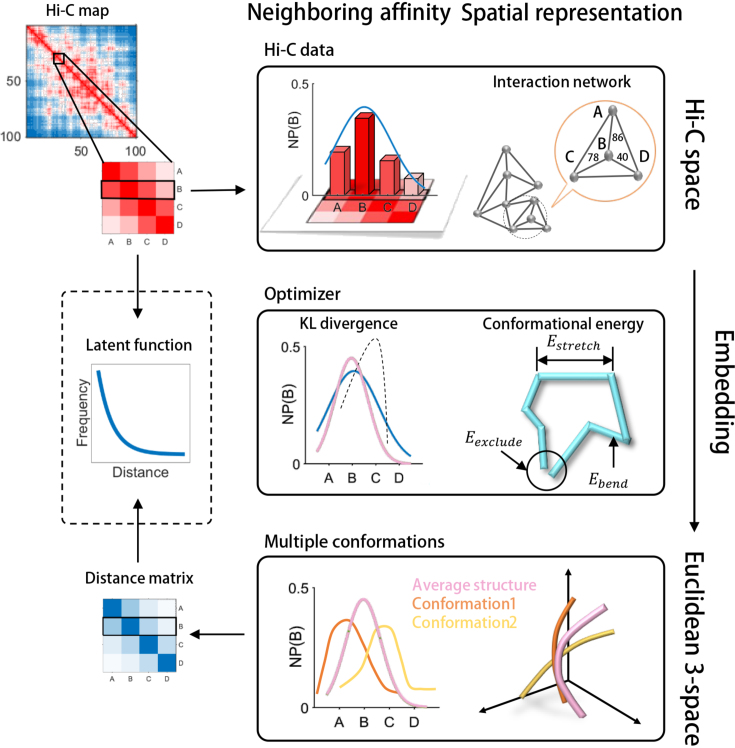
Figure 1.
A schematic illustration of the GEM pipeline. The genomic loci A, B, C and D are selected as an example to demonstrate our pipeline. We first build up an interaction network from the input Hi-C data to represent the organizations of chromatin structures in Hi-C space. In this interaction network, each node represents a genomic loci and each edge represents a pairwise interaction describing the neighbouring affinity between genomic loci in Hi-C space. Based on an optimization that considers both the KL divergence between experimental and reconstructed Hi-C data and the conformational energy, the interaction network is then embedded into 3D Euclidean space to reconstruct the 3D chromatin structures. During the embedding process, we first calculate an average conformation as an initial structure, and then refine the initial structure to obtain an ensemble of conformations through a multi-conformation optimization technique (see Materials and Methods). Finally, we can infer the latent function between Hi-C interaction frequencies and spatial distances between genomic loci based on the input interaction frequency matrix and the output spatial distance matrix derived from GEM (shown in the dashed box). Neighboring probability, NP(B), in the figure represents the probability of the spatial interaction between current genomic and genomic locus B.

