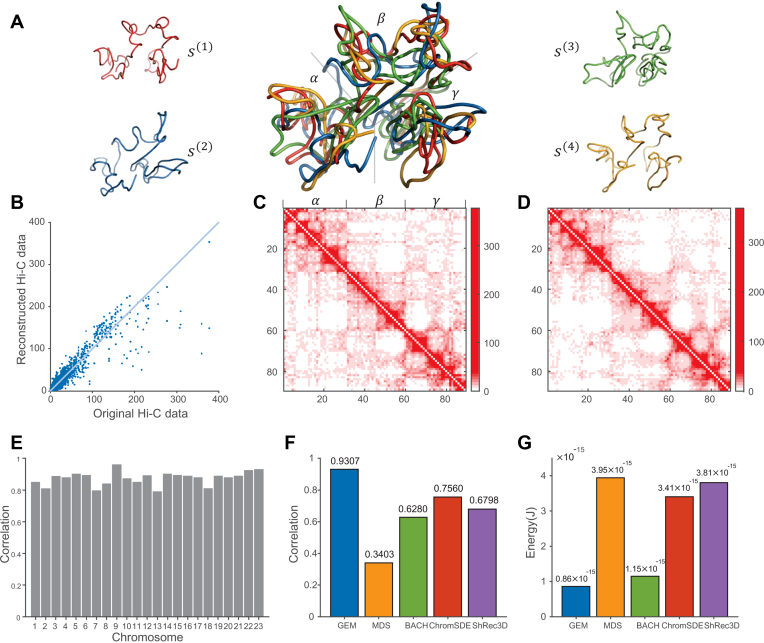
Figure 3.
The chromatin structure modeling results on human chromosomes under 1 Mb resolution. (A) Visualization of the computed ensemble of human chromosome 14. The four conformations {s(1), s(2), s(3), s(4)} in the derived ensemble are shown in red, blue, green and orange, respectively. The middle shows the superimposition of all four conformations, which were all aligned using the singular value decomposition (SVD) algorithm (54). The three large isolated regions (α, β, γ) which can be facilely distinguished from the reconstructed 3D conformations were consistent well with those detected based on the original Hi-C map (see (C)). (B) The 10-fold cross-validation results for human chromosome 14, in which the scatter plot of the reconstructed Hi-C data derived from the modeled structures vs. the original Hi-C data is shown. (C, D) The original interaction frequency map derived from experimental Hi-C data and the reconstructed Hi-C map predicted by the modeled structures for human chromosome 14 in the 10-fold cross-validation results, respectively. In the Hi-C maps, the axes denote the genomic loci (1 Mb resolution) and the values of the entries indicate the experimentally measured (C) and predicted (D) interaction frequencies, respectively. (E) Bar graph depicting mutual validation by two sets of experimental Hi-C data for individual 23 human chromosomes, which were collected using two different restriction enzymes (i.e., HindIII vs. NcoI), respectively. (F, G) Comparison results between different modeling methods, in terms of the agreement between experimental and predicted Hi-C data and the conformational energy, respectively.

