Figure 4.
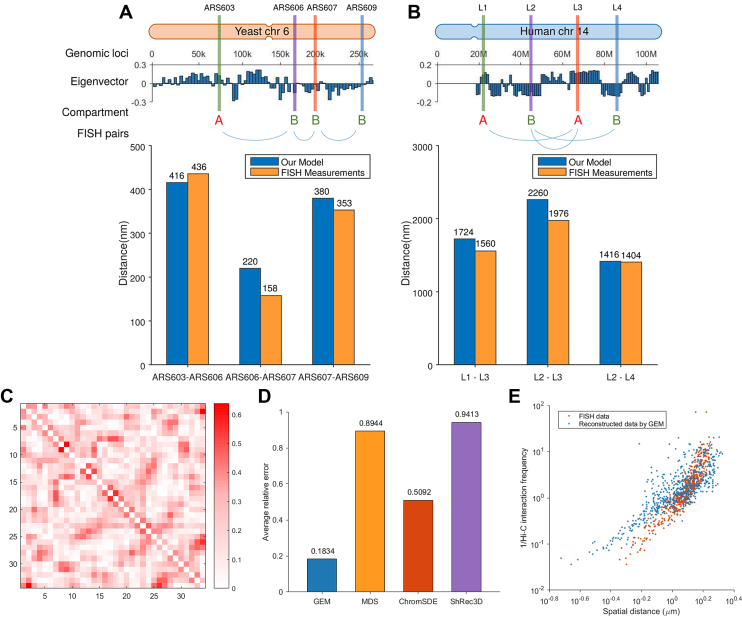
The validation results on the known pairwise distance constraints derived from the FISH imaging data of yeast and human. (A) The validation results on the FISH imaging data of yeast chromosome 6. ARS603, ARS606, ARS607 and ARS609 lie consecutively along the chromosome. The genomic distance intervals of ARS603, ARS606, ARS607 and ARS609 are 103, 32 and 56 kb, respectively. ARS603 belongs to compartment A, while the other three loci belong to compartment B. (B) The validation results on the FISH imaging data of human chromosome 14. L1, L2, L3 and L4 lie consecutively along the chromosome. The genomic distance intervals of L1, L2, L3 and L4 are 23, 22 and 19 kb, respectively. L1 and L3 belong to compartment A, while L2 and L4 belong to compartment B. In (A) and (B), top shows the schematic illustrations of the locations of genomic loci used in the validation. Compartment partition was performed based on the eigenvectors of the Hi-C maps computed by principal component analysis (PCA) (7). Bottom shows the bar graphs depicting the comparisons between the mean distances between genomic loci derived from FISH imaging data and reconstructed by GEM. (C–E) The validation results on the FISH data (48) that include FISH distances between 34 TADs on human chromosome 21. (C) Visualization of the relative errors between the reconstructed distances by GEM and FISH distances, in which the axes denote the index of TADs and the values of the entries indicate the relative errors. (D) Comparison between different models in terms of relative errors between reconstructed spatial distances and FISH distances averaged over all pairs of TADs. (E) Red scatter plot shows the inverse Hi-C interaction frequencies between individual pairs of TADs versus their corresponding spatial distances derived from the FISH imaging data, while blue scatter plot shows the inverse Hi-C interaction frequencies between individual pairs of TADs versus their corresponding mean spatial distances computed by GEM.

