Figure 5.
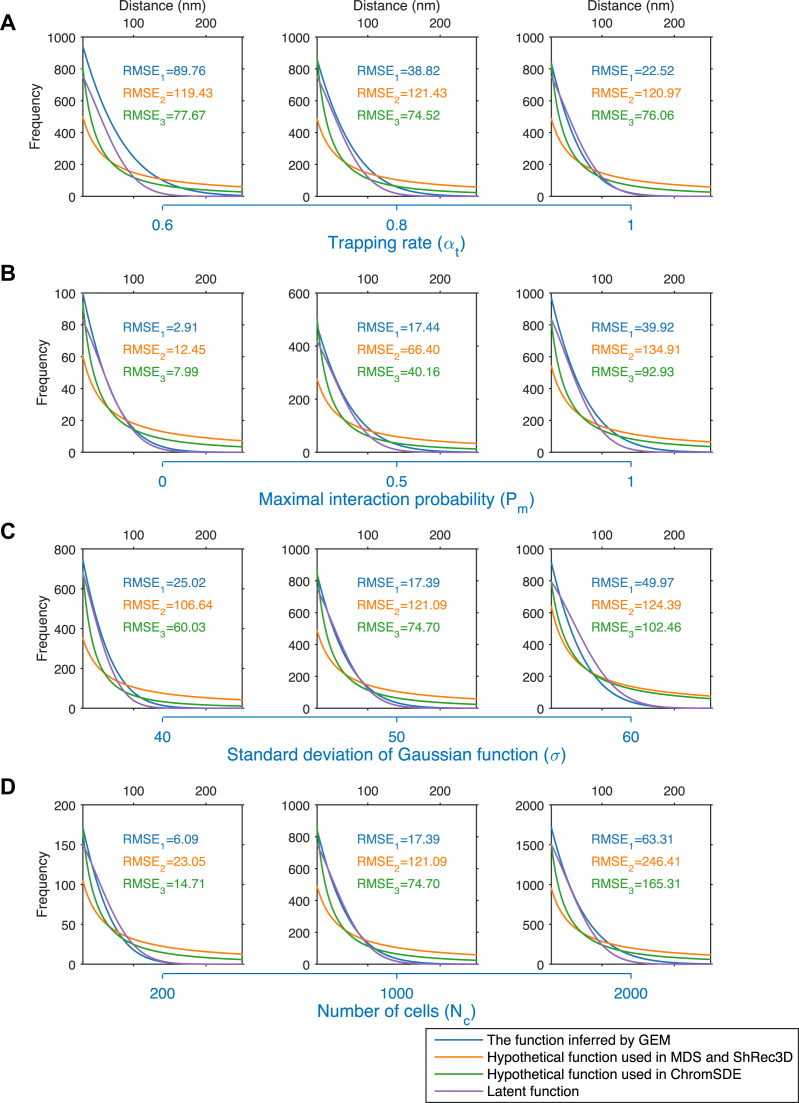
Relationships between Hi-C interaction frequencies and reconstructed spatial distances derived based on different test settings of simulated Hi-C data. The purple curves depict the latent relationships between Hi-C interaction frequencies and reconstructed spatial distances derived based on the tests on simulated Hi-C data, which were generated according to different settings of the trapping rate αt (A), the maximum interaction probability Pm (B), the standard deviation of Gaussian function σ (C), and the number of cells Nc (D), respectively. The blue, orange and green curves show the functions inferred by GEM, the hypothetical function F∝1/D used in the MDS (29,30) based model and ShRec3D (18), and the hypothetical function F∝1/Dα used in ChromSDE (17), respectively. The root-mean-square error (RMSE) was used to measure the distances between these functions used in the modeling frameworks (shown in blue, orange or green curves) and the latent functions (shown in purple curves), which can be derived from the parameter settings used to generate the simulated Hi-C data.

