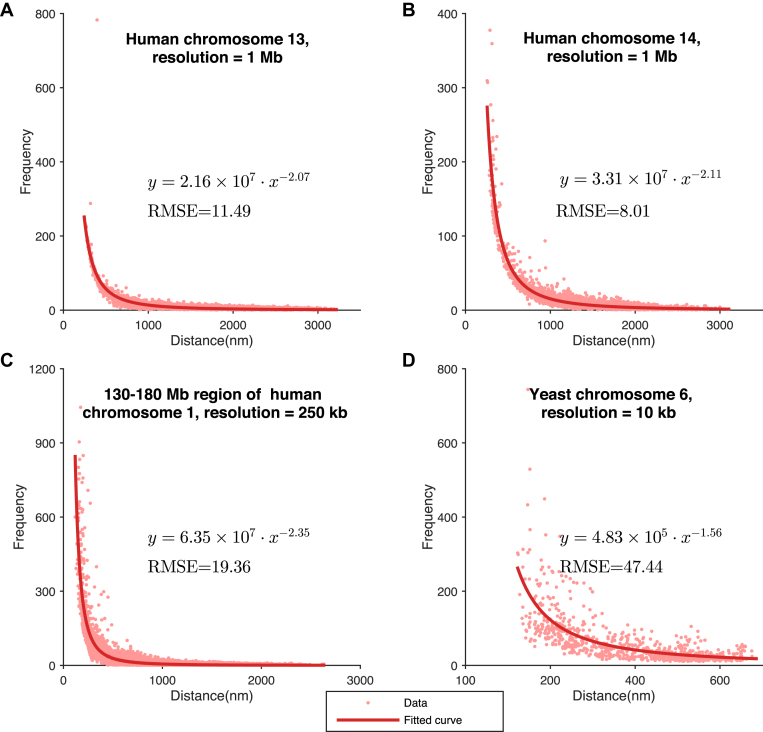
Figure 6.
Relationships between Hi-C interaction frequencies and reconstructed spatial distances derived from the chromatin structures modeled by GEM on experimental Hi-C data. (A–D) The latent functions inferred by GEM between Hi-C interaction frequencies and reconstructed spatial distances on human chromosome 13 at 1Mb resolution, human chromosome 14 at 1Mb resolution, a 130Mb-180Mb region of human chromosome 1 at 250 kb resolution, and yeast chromosome 6 at 10 kb resolution, respectively. The functions were obtained by curve fitting to the points representing the pairs of Hi-C interaction frequencies and reconstructed spatial distances in the modeled structures. The expressions of the derived functions and the fitting results measured in terms of the root-mean-square errors (RMSEs) are also shown.

