Figure 7.
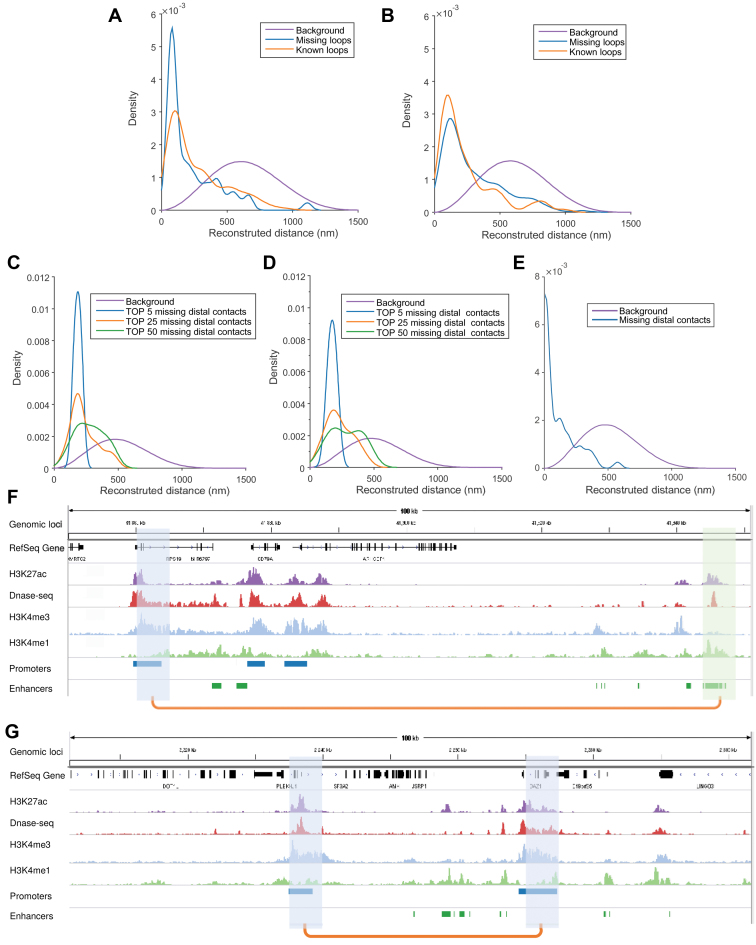
Application of the chromatin structures reconstructed by GEM into the recovery of missing long-range loops or contacts. (A, B) The recovery results on the missing loops on human chromosome 19 in the GM12878 cell line at 5 kb resolution from the Hi-C data of replicate 1 and replicate 2 (50), respectively. The orange curves represent the distributions of known loops (which were present in the Hi-C data of current replicate), while the blue curves represent the distributions of missing loops (which were missing in current replicate but present in the other replicate). The purple curves show the background distributions, i.e., the distributions of spatial distances in the reconstructed structures. The HiCCUPS algorithm (50) implemented in the Juicer tools (55), with 0.1% FDR, was used to call chromatin loops from Hi-C maps. (C–E) The recovery results on the missing promoter–promoter and promoter–enhancer contacts on human chromosome 19, using the chromatin structures reconstructed by GEM based on the promoter-other contacts derived from the capture Hi-C data (51). The purple curves show the background distributions, i.e. the distributions of all the reconstructed spatial distances (as in (A, B)), while the other curves represent the distributions of the promoter–promoter or promoter–enhancer contacts that were missing in the input promoter-other capture Hi-C data (51) but present in an independent Hi-C map (C), the promoter–promoter contacts derived from another capture Hi-C data (D), or the promoter–enhancer contacts identified by PSYCHIC (52) from an independent Hi-C map (50), all of which were also called the validation Hi-C data. In (C) and (D), the blue, orange and green curves represent the distributions of the top 5, 25 and 50 missing promoter–promoter contacts which had the highest interaction frequencies in the validation Hi-C data. In Panels (F), the blue curve represents the distribution of the missing promoter–enhancer contacts in the validation Hi-C data. (F, G) Two examples on the recovered promoter–enhancer (F) or promoter–promoter (G) contacts on human chromosome 19 of the GM12878 cell line that were recovered from the chromatin structures reconstructed by GEM from one Hi-C dataset and can be validated by another independent Hi-C dataset. The recovered loops are shown by orange linkers on the bottom, while the connected promoter and enhancers regions (which were annotated using the combination of ENCODE Segway (56) and ChromHMM (57) as in (58)) are shown in blue and green, respectively. Among the lists of chromatin features, H3K27 and DNase-seq signals indicate the active and accessibility states of both ends of chromatin loops, while the states of promoters and enhancers are marked by H3K4me3 and H3K4me1, respectively. All ChIP-seq and DNase-seq data were obtained from the ENCODE portal (59). The human reference genome GRCh38/hg38 was used.

