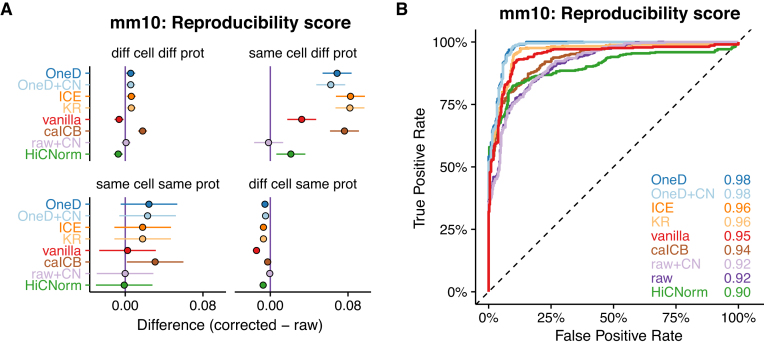
Figure 3.
Removing biases from Hi-C on normal karyotypes. (A) Average changes compared to the raw data on the mouse data set. Upper left panel: Different cell type samples processed using different protocols. Upper right panel: Same cell type samples processed using different protocols. Lower left panel: Same cell type samples processed using the same protocol. Lower right panel: Different cell type samples processed using the same protocol. (B) ROC curves on the mouse data set. The legend and color code are as in Figure 2.

