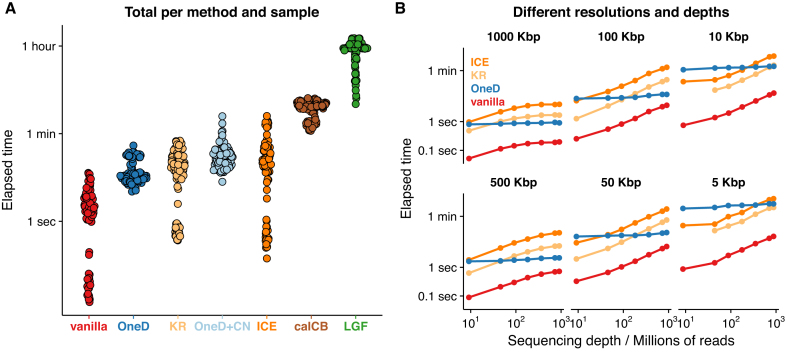
Figure 6.
Computing time of the bias correction methods. (A) Total time to process samples listed in Supplementary Table S1 at 100 kb resolution. Each dot corresponds to a sample. (B) Total time to process sample HIC070 at the indicated bin size and sequencing depths. Note the logarithmic scale on the y-axis on both panels.

