Figure 2.
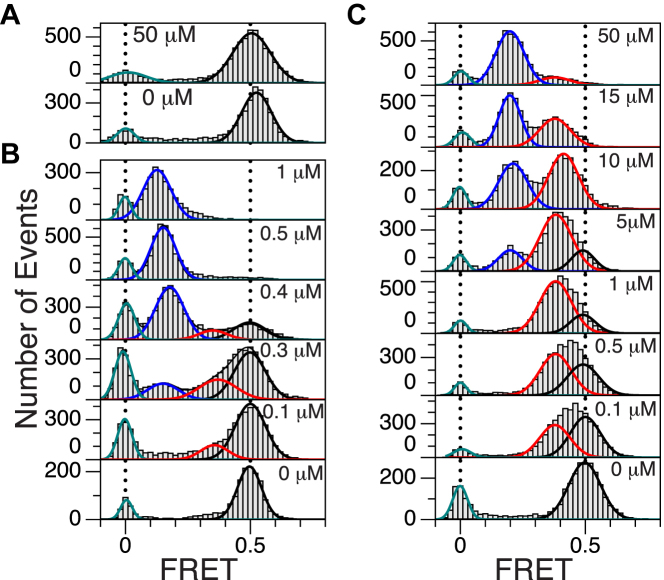
FRET histograms for GC and TG repeats at the indicated protein (hZαADAR1) concentrations. (A) FE histograms of a scrambled sequence in the absence (bottom) and presence (top) of 50 μM hZαADAR1. (B) FE histograms of (GC)11 with various concentrations of hZαADAR1 (0, 0.1, 0.3, 0.4, 0.5 and 1 μM from bottom to top). A new peak at FE ∼0.15 corresponds to the Z-DNA state. (C) FE histograms of (TG)11 with various concentrations of hZαADAR1 (0, 0.1, 0.5, 1, 5, 10, 15 and 50 μM from bottom to top). At 50 μM hZαADAR1, the peak at FE ∼0.2 becomes dominant. The curves (blue: Z-DNA, red: B*-DNA, black: B-DNA, green: donor-only) in each panel represent multiple Gaussian fits for histogram. Two vertical dotted lines in each panel are at FE = 0 (left) and 0.5 (right), which represent donor-only and B-DNA peaks, respectively.

