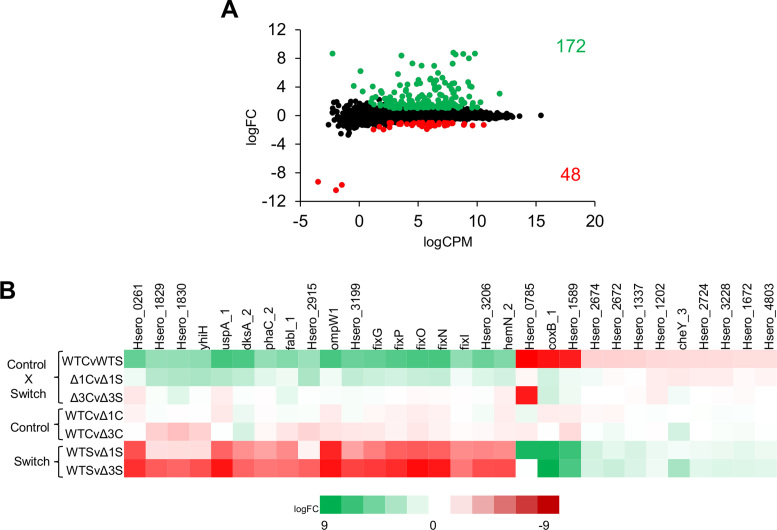
Figure 1.
Transcriptional profiling reveals differential gene expression after the switch from high (control, C) to low (switch, S) oxygen conditions. (A) Plot showing the relationship between the average expression (logCPM) and fold-change (logFC) for the RNA-Seq library comparisons (control versus switch) in the wild type strain (WTCvWTS). Green dots indicate genes that were up regulated upon switch to low oxygen, while the red dots represent the genes that were down regulated (P < 0.001 and 1 ≤ logFC ≤ –1). (B) Heat map showing a subset of the most highly differentially expressed genes (up and down regulated) across the comparisons made between all transcript mappings. The abbreviations indicate the following: WT – wild type (SmR1); Δ1 – fnr1 deletion; Δ3 – fnr3 deletion; C – control (high aeration, 350 rpm); S – switch to low aeration (120 rpm). The differential expression comparisons are: WTCvWTS, wild type control (350 rpm) versus switch (120 rpm); Δ1CvΔ1S, fnr1 deletion control versus switch; Δ3CvΔ3S, fnr3 deletion control versus switch; WTCvΔ1C, wild type versus fnr1 deletion under control conditions; WTCvΔ3C, wild type versus fnr3 deletion under control conditions; WTSvΔ1S, wild type versus fnr1 deletion under switch conditions; WTSvΔ3S, wild type versus fnr3 deletion under switch conditions.

