Figure 2.
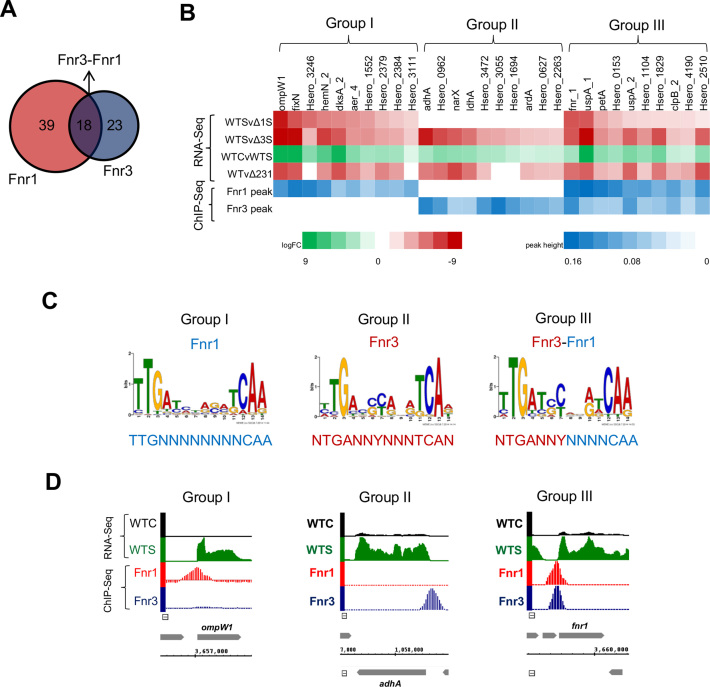
Correlation of RNA-Seq and ChIP-Seq reveals three groups of regulated promoters. (A) Overview of the number of specific targets identified for Fnr1 and Fnr3 identified by correlation of ChIP-Seq peaks with the transcriptional changes revealed by RNA-Seq. (B) Heat map showing the correlation between the differential expression revealed by the RNA-seq with the ChIP-Seq peak heights. For each regulatory group (Groups I, II and III) identified, a subset of the most highly differentially expressed genes associated with significant ChIP-Seq peak enrichment are shown. The differential expression comparisons are: Δ1CvΔ1S, fnr1 deletion control versus switch; Δ3CvΔ3S, fnr3 deletion control versus switch; WTCvWTS, wild type control (350 rpm) versus switch (120 rpm); WTvΔ231, wild type versus triple fnr deletion under 5% oxygen (11). (C) DNA-binding motifs identified by MEME for Groups I, II and III of regulated promoters. (D) Visualization of ChIP-Seq peaks in correlation with transcripts mapping to representative genes within each regulatory group. Abbreviations and colour coding for the RNA-Seq data are as follows: WTC, wild type under 350 rpm (black); WTS, wild type after switch to 120 rpm (green). The ChIP-Seq data for Fnr1–3xFlag and Fnr3–3xFlag strains is presented in red and blue, respectively.

