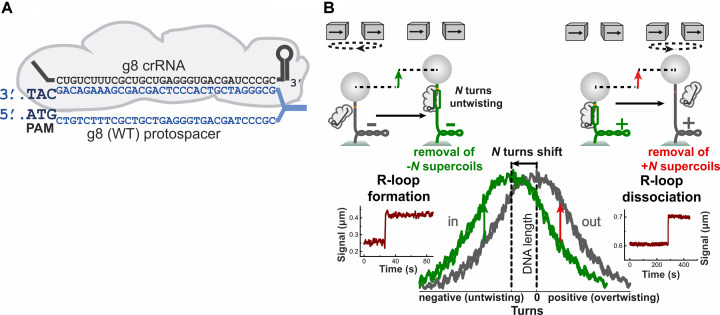
Figure 1.
Principle of the magnetic tweezers assay used to study R-loop complexes. (A) Schematic representation of the R-loop complex formed by the E. coli Cascade (gray) bound to the wild-type g8 protospacer target (blue). The crRNA is shown in black. (B) A scheme of the magnetic tweezers assay to detect formation and dissociation of single R-loops (see text for detailed explanation). The left side illustrates R-loop formation on negatively supercoiled DNA. DNA unwinding by R-loop formation absorbs about 3 turns of negative supercoiling, leading to a DNA length increase (see green arrow in sketch on top and example trajectory on the bottom). The right side illustrates R-loop dissociation on positively supercoiled DNA (see red arrow in sketch). DNA rewinding upon R-loop dissociation absorbs about 3 turns of positive supercoiling, also leading to DNA length increase. The plot at the bottom, center, shows the characteristic DNA supercoiling curve (DNA length vs. turns) in the absence (gray) and the presence (green) of bound Cascade. The curves are shifted relative to each other due to unwinding of helical turns by the Cascade. Green and red arrows mark R-loop formation and dissociation at negative and positive supercoiling, respectively.

