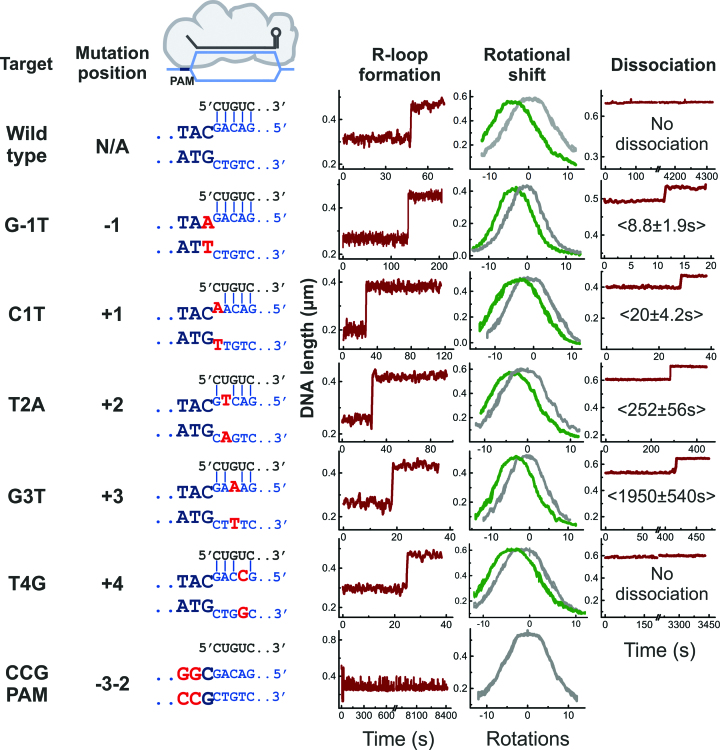
Figure 2.
Example trajectories of R-loop formation and dissociation by E. coli Cascade measured with magnetic tweezers. Data is shown for all investigated target variants (nomenclature, mutation positions and base-pairing schemes, with mutations indicated in red, are shown on the left side). R-loop formation is seen as a sudden DNA length jump at negative supercoiling (left trajectories recorded at 0.4 pN force and about –7 turns) and as a shift of the supercoiling curve (middle trajectories, grey and green curves refer to unbound and bound DNA). R-loop dissociation is seen as a length jump at positive supercoiling (right trajectories including mean dissociation times taken at 5 pN force and about +12 turns). Shown trajectories were smoothed with a sliding average filter of 1 s.

