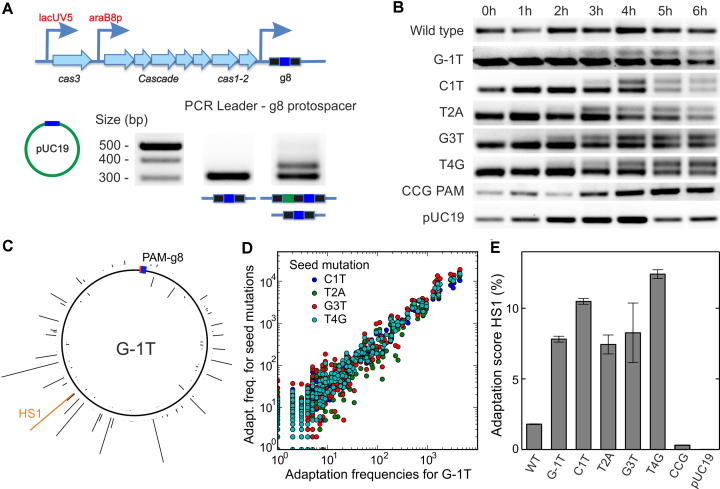
Figure 7.
Priming by g8 target variants. (A) Scheme of the E. coli KD263 CRISPR locus. The cas gene expression is controlled by inducible promoters. The CRISPR array consists of a single g8 spacer (blue boxes) surrounded by two repeats (black boxes). Priming is induced by transforming the cells with pUC19 plasmids carrying the protospacer variants. Incorporation of new spacers (green box) is revealed using PCR amplification of the CRISPR array and agarose gel electrophoresis. (B) Incorporation of new spacers probed at different times after induction for the indicated g8 protospacer variants. (C) Mapping of spacers acquired from the G-1T variant target protospacer plasmid to the pUC19 backbone (see Supplementary Figure S7 for other target variant plasmids). The height of the histogram bars corresponds to the number of HTS reads found for a particular position. The location of the priming protospacer and the PAM is shown as a blue-red box. The histogram entry in orange marks the hotspot HS1, which was used for semi-quantitative measurements of the primed adaptation efficiency (see E). (D) Position-dependent acquisition frequency for targets with seed mutation plotted over the acquisition frequency for the G-1T PAM mutation target. A high correlation between spacer acquisition patterns of all tested target variants (see Supplementary Figure S7B for correlation coefficients) is apparent. (E) Relative frequency of priming (i.e. CRISPR array extension) probed by qPCR with a primer specific for the frequently incorporated protospacer HS1 (see C) for the different target variants. Error bars represent the standard deviation of three repeat measurements.

