Figure 1.
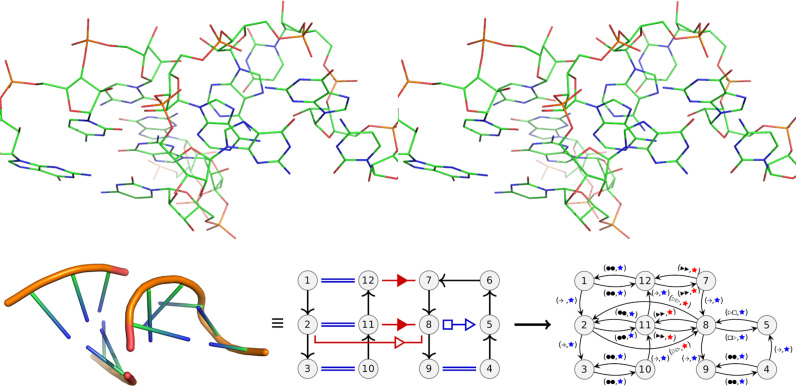
Up: a stereo view of a GNRA tetraloop interacting with two Watson–Crick pairs of a helical fragment (from chain A in 4QCN). Below:left: the same substructure, coarse grained. Middle: the annotated substructure, with the Leontis–Westhof representation. In all figures, the long-range interaction are shown in red, local in blue with their Leontis–Westhof annotations, cWW are shown as double lines. The sugar–phosphate backbone is in black, connected by arrows and directed 5′ → 3′. The nucleotides belonging to a network are numbered sequentially. Right: the interaction graph. To build the interaction graph there are two main operations. First the nucleotides without any interaction are removed (nucleotide 6), then the interactions are replaced by labeled doubled directed edges. Nodes with only backbone interactions are removed. The first label of each edge indicates the type of interaction of the base pair, first the interacting face of the source followed by the interacting face of the target. The second label indicates if the interaction is local to an SSE (blue) or long-range (red). This interaction graph is provided in larger size in the Supplementary Figure S3.

