. 2018 Mar 5;9(14):3477–3483. doi: 10.1039/c7sc05355j

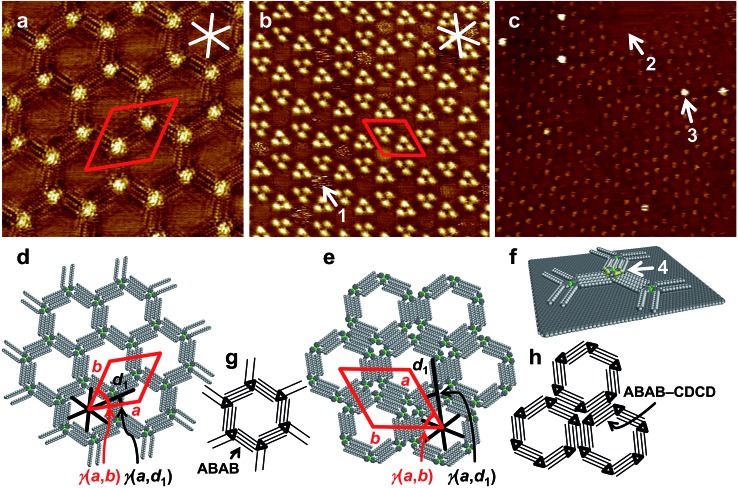
Fig. 4. (a)–(c) STM images, (d)–(f) supramolecular models, and (g)–(h) schematic models of self-assembled ad-layers. (a), (d), (g): Low-concentration polymorph (pol. A) of 1e (a: c = 3 × 10⁻⁶ M, 20 × 20 nm2, VS = –0.15 V, It = 24 pA; a = b = (5.6 ± 0.2) nm, γ(a,b) = (60 ± 2)°, γ(a,d1) = (15 ± 1)°); (b), (e), (h) high-concentration polymorph (pol. B) of 1e (b: c = 10–5 M, 42.8 × 42.8 nm2, VS = –0.8 V, It = 10 pA; a = b = (7.1 ± 0.2) nm, γ(a,b) = (60 ± 2)°, γ(a,d1) = (19 ± 1)°; both samples were thermally annealed for 20 s at 80 °C prior to imaging); (c), (f): nanopattern of 1e (0.5 μL of a 3 × 10⁻⁶ M solution, thermally annealed for 20 s at 80 °C) to which (after cooling to r.t.) 0.5 μL of a 10–3 M solution of 2c were added (75 × 75 nm2 (internal scanner calibration), VS = –0.9 V, It = 18 pA). White (black) and red lines indicate HOPG main axis directions and unit cell vectors, respectively.

Fig. 4