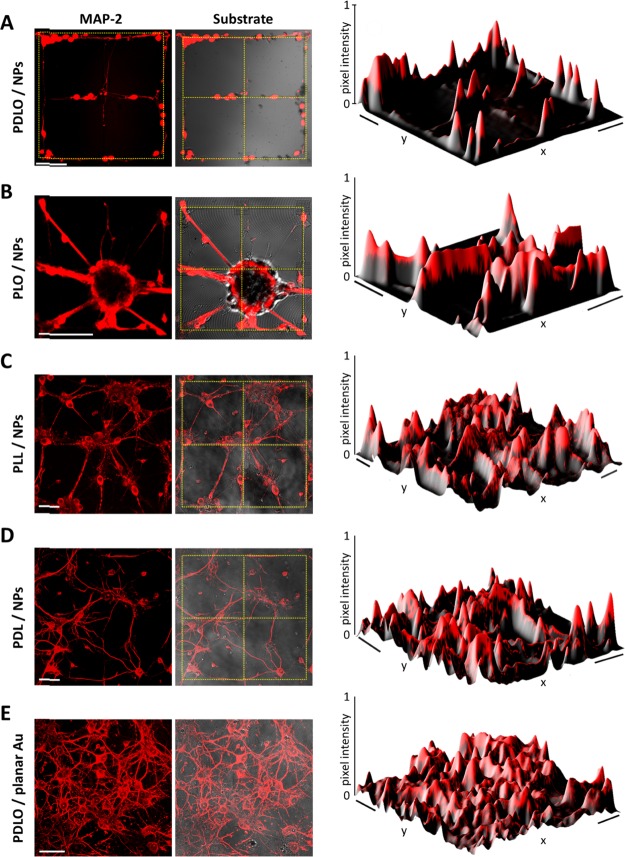
Figure 2.
Fluorescence images displaying the reliance of neuronal morphological arrangement on combinatorial biochemical and physical cues. (A) Hippocampal neurons stained with MAP-2 and overlaid on 3D NP grid substrate showing a precise guidance on PDLO/NP grid pattern. The Intensity profile of neuronal MAP-2 fluorescence signal detected in neurons grown on PDLO/NP grid pattern. The yellow dotted grids denote the region of 3D NP array. (B) As in (A) but for neurons grown on PLO/NP substrate that evince the paucity of cell guidance and fasciculate neuronal processes. The intensity profile of MAP-2 fluorescence signal observed in neurons grown on PLO/NP grid pattern. (C) As in (A,B) but for neurons grown on PLL/NP substrate that evident a random nonpatterned neuronal growth. The intensity profile of neurons grown on PLL/NP grid pattern. (D) As in (C) but for random morphological arrangement and intensity profile of neurons grown on PDL/NP grid pattern. (E) Neurons grown on a planar Au substrate coated with PDLO display a random morphological arrangement. Scale bars represent 50 μm for all images on the left. Scale bars represent (40 μm × 40 μm, 30 μm × 30 μm, 70 μm × 70 μm, and 40 μm × 40 μm) for the intensity profiles from A to E, respectively.

