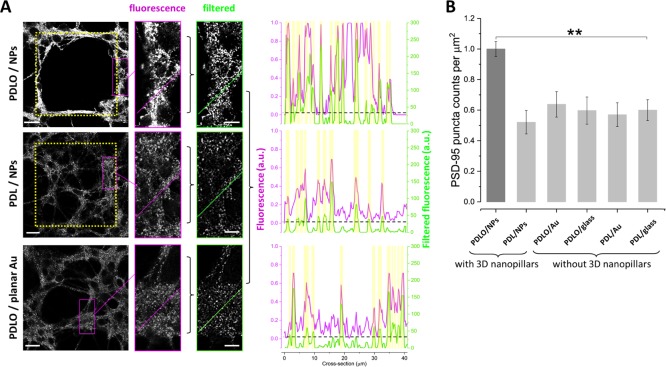
Figure 4.
Quantification of combinatorial effects of nanotopographical and biochemical cues on synaptic maturation and stability. (A) (Left) Confocal micrographs displaying neuronal PSD-95 expression on 3D NPs functionalized with PDLO and PDL and on a planar Au surface functionalized with PDLO. (Right) Quantification of PSD-95 protein expression is performed by processing the images with the granulometric filter method. The magenta and green cross sections indicate the fluorescence and the corresponding filtered intensities, respectively. The start and the end positions of the cross sections are read from the left (0 μm) to the right (40 μm). The yellow dotted grids denote the regions of 3D NPs. The position of the PSD-95 puncta was defined above an arbitrary offset on the filtered fluorescence scale, that is, 30, indicated by the black dotted lines. All scale bars represent 30 μm in images on the left and 10 μm in images on the right. (B) Bar graph showing the quantified combinatorial effects of nanotopographical cues (3D NPs, planar Au, and planar glass surfaces) and biochemical cues (PDLO and PDL) conferred by the normalized numbers of PSD-95 ensembles (density). PSD-95 puncta is significantly higher in neurons grown on PDLO/NPs (1 ± 0.048) compared to (0.52 ± 0.076, 0.63 ± 0.083, 0.59 ± 0.088, 0.57 ± 0.077, and 0.59 ± 0.068) for neurons grown on PDL/NPs, PDLO/planar Au, PDLO/planar glass, PDL/planar Au, and PDL/planar glass, respectively. (n = 4, **p < 0.01, ANOVA).

