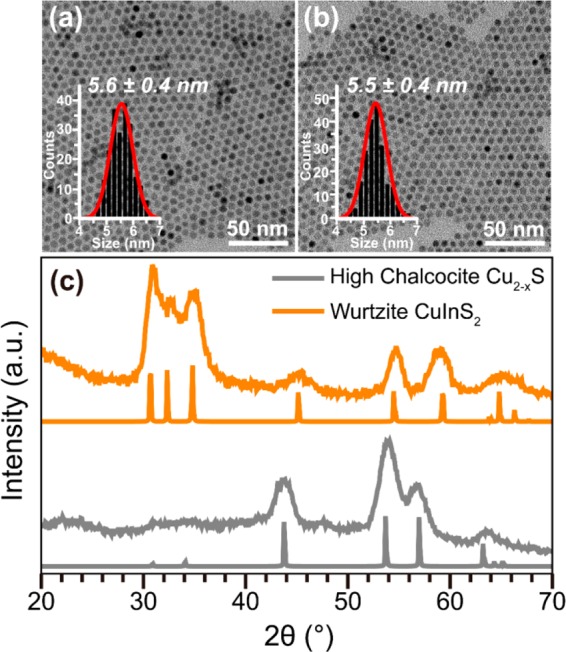
Figure 1.

(a,b) TEM images and corresponding size histograms of CIS NCs (b) obtained by partial Cu+ for In3+ CE in template Cu2–xS NCs (a). The size histograms are constructed by measuring over 200 NCs and are fitted to a Gaussian distribution function. (c) X-ray diffraction patterns of template Cu2–xS NCs and product CIS NCs. The gray lines indicate the high chalcocite Cu2S diffraction pattern (JCPDS Card 00-026-1116). The orange lines indicate the wurtzite CIS diffraction pattern (JCPDS Card 01-077-9459).
