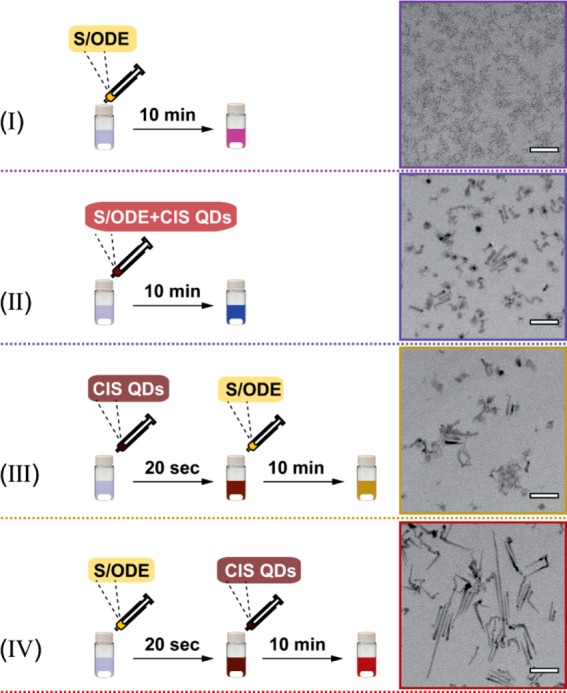
Figure 2.

Schematic illustration of four seeded injection methods. All the experimental conditions are the same unless otherwise specified. (I) S/ODE (control experiment, no CIS NC seeds were added), (II) a mixture of S/ODE and CIS NC seeds is injected, (III) CIS NC seeds followed by S/ODE (injection interval time, 20 s), (IV) S/ODE followed by CIS NC seeds (injection interval time, 20 s). The corresponding TEM images of purified products are displayed on the right side of the panel. Scale bars are 50 nm.
