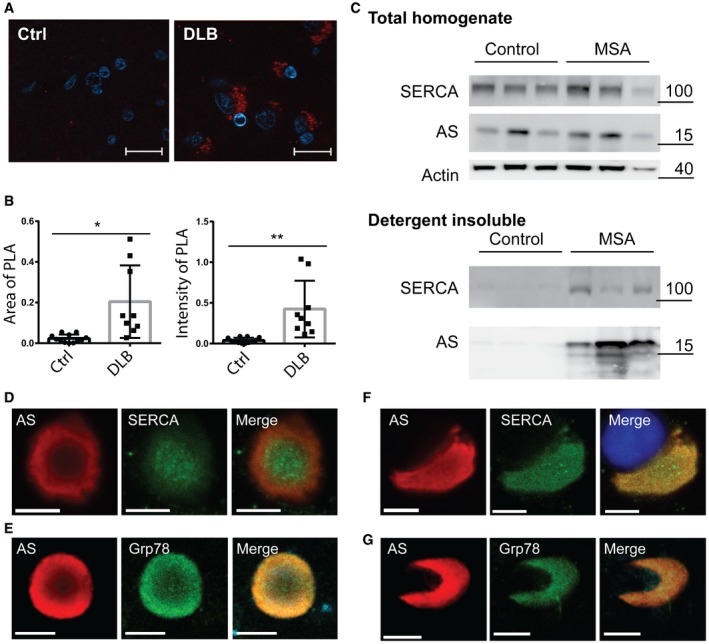
Figure 7. AS and SERCA co‐occur in synucleinopathies.

- Representative image of proximity ligation assay using SERCA2 and syn211 as antibody pair on 5‐μm sections paraffin‐embedded human frontal cortex from DLB case (DLB) and occipital cortex from neurological healthy case (Ctrl). Scale bar is 20 μm.
- The proximity ligation signal was quantified in 10 randomly distributed microscopic images using ImageJ as mean area ± SD covered by PLA signal (left graph) and mean PLA intensity ± SD in the covered area (right graph) of signal above 3× the background signal (Student's t‐test, *P = 0.0023, **P = 0.0011).
- Immunoblot analysis of extracts from human cerebellar dentate nucleus from three neurological healthy cases (Control) and three cases with multiple system atrophy (MSA). Presented is the total homogenate and the detergent‐insoluble fraction solubilised in 5% SDS, 8 M urea prior to immonoblotting analysis (detergent insoluble). The molecular markers for the individual immunoblots are presented to the right of the panels.
- Immunostaining of isolated Lewy body (LB) from a PD patient labelled for AS and SERCA2 immunoreactivity. Scale bar is 5 μm.
- Immunostaining of isolated LB from a patient with DLB labelled for AS and ER marker GRP78. GRP78 reactivity is present in the inclusion. Scale bar is 7.5 μm.
- Immunostaining of isolated glial cytoplasmic inclusion (GCI) from MSA patient labelled for AS and SERCA. DAPI stains a co‐isolated oligodendrocyte nucleus. Scale bar is 5 μm.
- Immunostaining of isolated GCI from MSA patient labelled for AS and GRP78. Scale bar is 7.5 μm.
