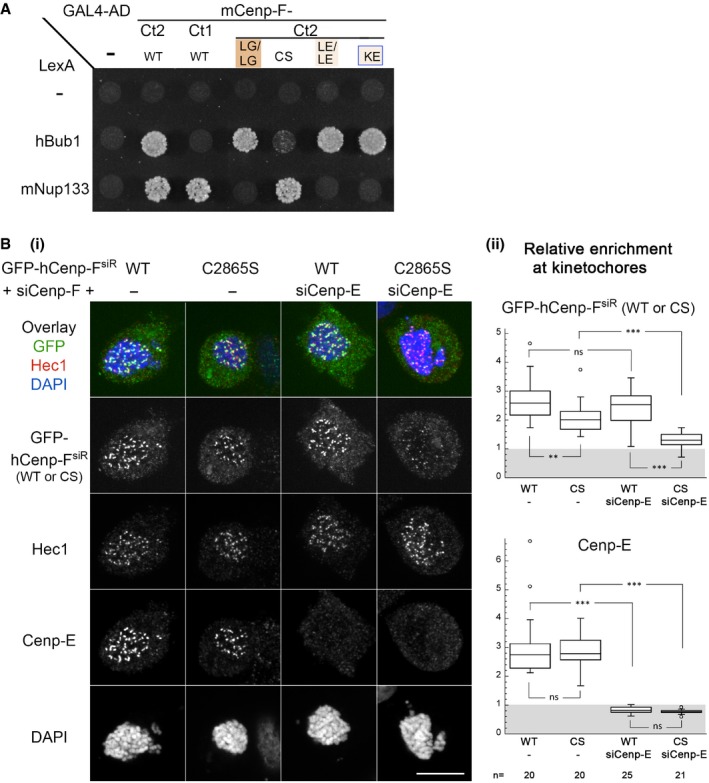
(i) HeLa‐E cells were transfected with siRNA duplexes targeting Cenp‐F (−) or both Cenp‐F and Cenp‐E (+siCenp‐E) along with a plasmid directing the expression of a Cenp‐F‐siRNA‐resistant form of GFP‐hCenp‐F (GFP‐hCenp‐F
siR), either WT or bearing the C2865S mutation (CS). Two days after transfection, cells were treated with Nocodazole (20 μM for 4 h), fixed, and immunolabeled with the indicated antibodies and DAPI. A projection of 11 z confocal sections of the individual stainings and the overlay between the GFP signal and Hec1 staining (used to identify and quantify kinetochores) are presented. Scale bar, 10 μm. (ii) The relative enrichment of GFP‐Cenp‐F and Cenp‐E at kinetochores was quantified as described in
Materials and Methods for
n cells from two independent experiments. Box plots were generated using KaleidaGraph (Synergy Software): Each box encloses 50% of the normalized values obtained, centered on the median value. The bars extending from the top and bottom of each box mark the minimum and maximum values within the dataset falling within an acceptable range. Values falling outside of this range are displayed as an individual point. Statistical analyses were performed using Wilcoxon–Mann–Whitney rank‐sum test. Standard conventions for symbols indicating statistical significance are used: ns, not significant:
P > 0.05; **
P ≤ 0.01; ***
P ≤ 0.001.

