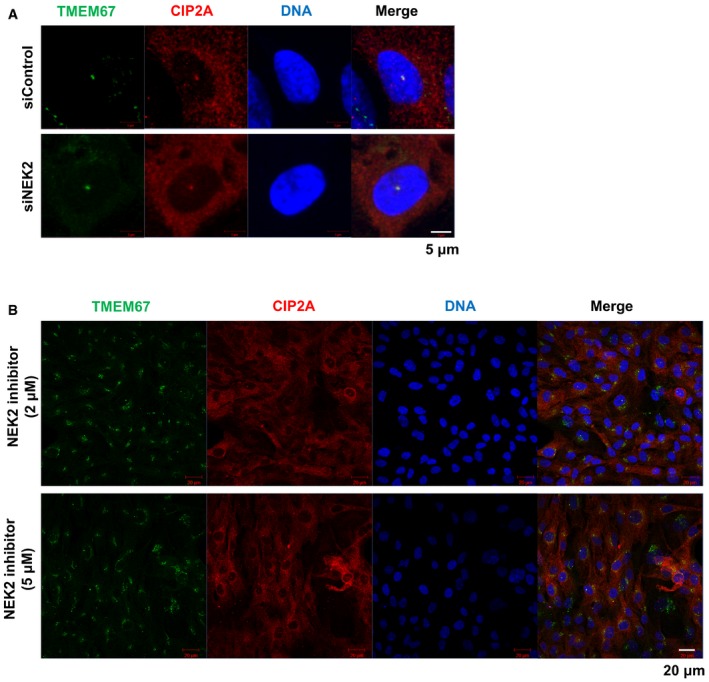
Figure EV2. CIP2A localization is NEK2 independent.

- Cells were transfected with control or NEK2 siRNAs for 48 h, and then fixed for staining and imaging. Shown are the maximum projections from z stacks; scale bar = 5 μm.
- Cells were treated with the NEK2 inhibitor Rac‐CCT 250863 for 24 h and then fixed for staining and imaging. Shown are the maximum projections from z stacks; scale bar = 20 μm.
