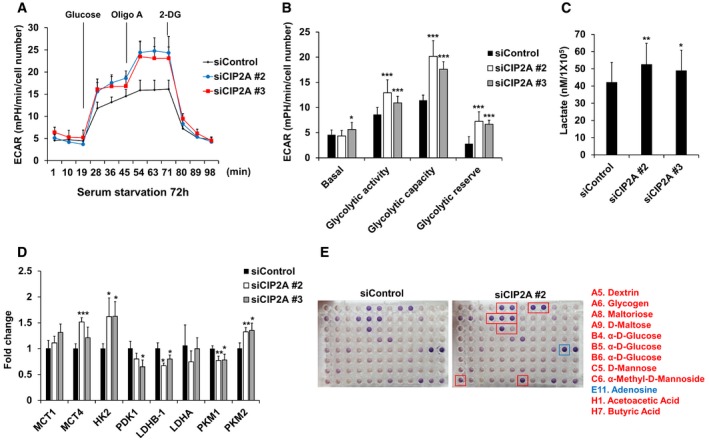
RPE1 cells were seeded onto Seahorse Bioscience V7 cell culture plates (4 × 10⁴/well) after siRNA transfection followed by serum starvation for 72 h. Time course for the measurement of ECAR indicates the basal conditions, followed by the sequential addition of glucose (10 mM), oligomycin (2 μM), and 2‐DG (20 mM). Data points are the average of a single representative experiment with error bars representing s.d. (n = 3 wells per condition). Experiments were independently repeated at least three times.
Graph of the results described in (A). Basal indicates basal levels; glycolytic activity indicates glucose‐stimulated ECAR; glycolytic capacity indicates oligomycin‐stimulated ECAR; and glycolytic reserve indicates the difference between the maximum glycolytic capacity and the basal glycolytic rate. Data were normalized to cell number. Data points are the average of a single representative experiment with error bars representing s.d. (n = 12 per condition). Experiments were independently repeated at least three times. *P < 0.05, **P < 0.01, ***P < 0.001 compared with siControl cells (one‐tailed Student's t‐test).
RPE1 cells were transfected with control, CIP2A #2, or CIP2A #3 siRNA. Cells were serum‐starved for 48 h, followed by glucose and amino acid starvation for 1 h. Glucose (10 mM) was added, and after 1 h, cell culture supernatants were collected and lactate production was measured using a Biovision kit. The average of three independent experiments is shown, with error bars representing s.d. *P < 0.05, **P < 0.01 compared with siControl cells (one‐tailed Student's t‐test).
Quantitative RT–PCR (qRT–PCR) analysis of the expression of MCT1, MCT4, HK2, PDK1, LDHB‐1, LDHA, PKM1, and PKM2 in cells transfected with control or CIP2A #2 or CIP2A #3 siRNA for 24 h and then serum‐starved for 48 h. 18S rRNA was used as a normalization control. The average of three independent experiments is shown, with error bars representing the s.d. *P < 0.05, **P < 0.01, ***P < 0.001 compared with siControl cells (one‐tailed Student's t‐test).
RPE1 cells were seeded onto BIOLOG plates PM‐M1 for 48 h after siRNA transfection followed by serum starvation for 24 h. The provided redox reagent was added to quantify substrate use at 590 and 750 nm. Red boxes indicate higher measurement, and blue box indicates lower measurement in siCIP2A #2 cells compared with siControl cells.

