-
A
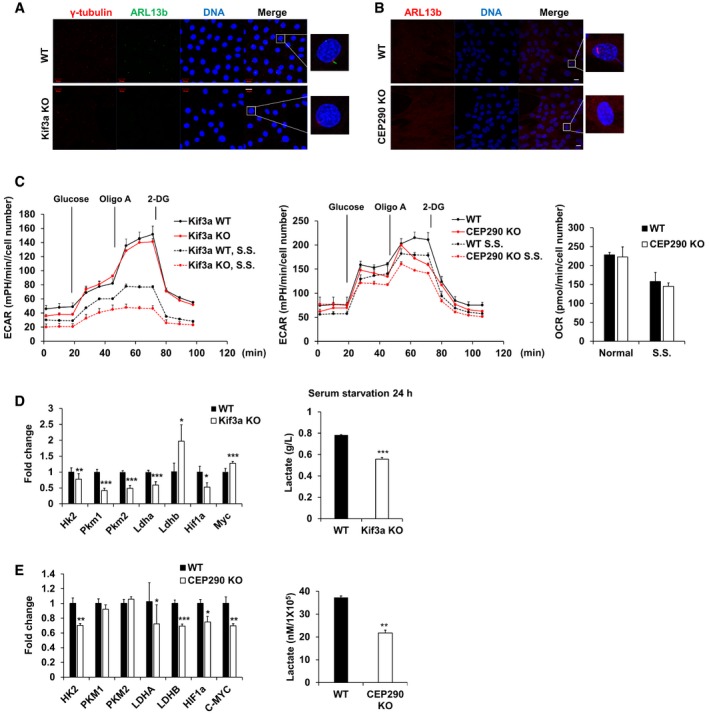
Immunofluorescence images of WT and Kif3a KO MEF cells were serum‐starved for 24 h. Centrosome was stained with antibodies specific for γ‐tubulin (red), and primary cilia were stained with antibodies specific for ARL13b (green) and DNA was stained with DAPI (blue). Shown are the maximum projections from z stacks of representative cells. Scale bar = 20 μm.
-
B
Immunofluorescence images of WT and CEP290 KO RPE1 cells which were serum‐starved for 24 h. Primary cilia were stained with antibodies specific for ARL13b (red), and DNA was stained with DAPI (blue). Shown are the maximum projections from z stacks of representative cells. Scale bar = 20 μm.
-
C
Kif3a WT and KO MEF cells or RPE1 WT and CEP290 KO cells were seeded onto Seahorse Bioscience V7 cell culture plates (4 × 10⁴/well). For serum‐starved conditions, the media were changed for serum deprived media for 24 h. Time course for the measurement of ECAR indicates the basal conditions, followed by the sequential addition of glucose (10 mM), oligomycin (2 μM), and 2‐DG (20 mM). OCR indicates the average of oxygen consumption rate during the measurement of ECAR. Data were normalized to cell number. Data points are the average of a single representative experiment with error bars representing s.d. (n = 4 wells per condition). Experiments were independently repeated at least three times. S.S., serum starvation.
-
D, E
qRT–PCR analysis of the expression of Hk2, Pkm1, Pkm2, Ldha, Ldhb, Hif1a, and Myc in Kif3a WT or Kif3a KO MEF cells cultured in the absence of serum for 24 h. Gapdh was used as a normalization control. Kif3a WT or Kif3a KO MEF cells were serum‐starved for 24 h, and then, cell culture media were collected and the lactate level was measured using YSI 2300 biochemical analyzer (YSI Life Science). The average of three independent experiments is shown, with error bars representing the s.d. *P < 0.05, **P < 0.01, ***P < 0.001 compared with WT MEF cells (one‐tailed Student's t‐test).

