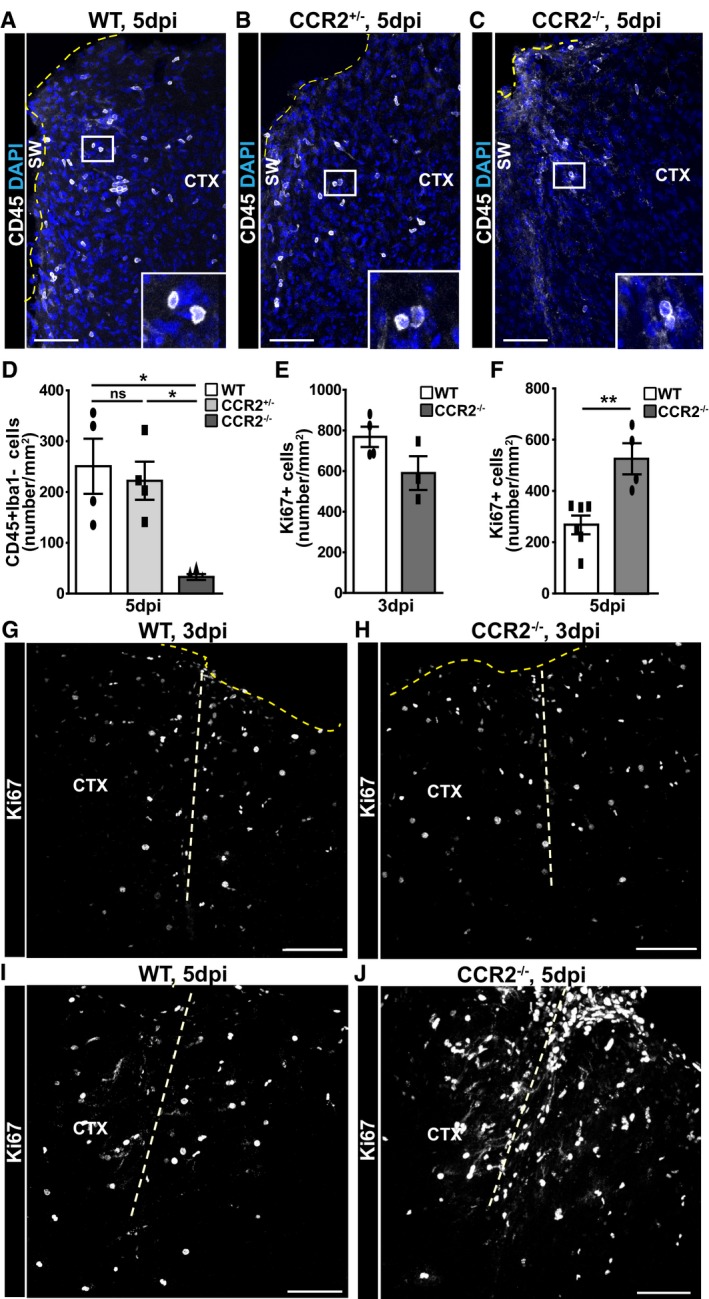
A–JConfocal images of CD45+ cells around the lesion site of WT (A), heterozygous CCR2+/− (B), and homozygous CCR2−/− (C) mice at 5 dpi and Ki67+ cells at 3 dpi (G, H) and 5 dpi (I, J) in WT (G, I) and homozygous CCR2−/− (H, J) mice. The dashed thick lines indicate the site of injury, the thin dark yellow dashed lines represent the pial surface. The cell nuclei were counterstained with DAPI. (D–F) Histograms depicting the numbers of CD45+ Iba1− cells (D) and Ki67+ cells in the injured cortical GM from mice of the indicated genotypes at 3 dpi (E) and 5 dpi (F) (one‐way ANOVA, Tukey's multiple comparison test, *P < 0.05, **P < 0.01, D: *P = 0.059, n = 4; E: P = 0.229, n = 4 for WT and n = 3 for CCR2−/−; and F: **P = 0.0087, n = 6 for WT and n = 4 for CCR2−/−), respectively. All data (dots and squares depict individual data points, i.e., animals) are represented as mean ± SEM. Significance of differences between means is indicated based on the P‐value (*P < 0.05, **P < 0.01). Scale bars: 100 μm.

