-
A, B
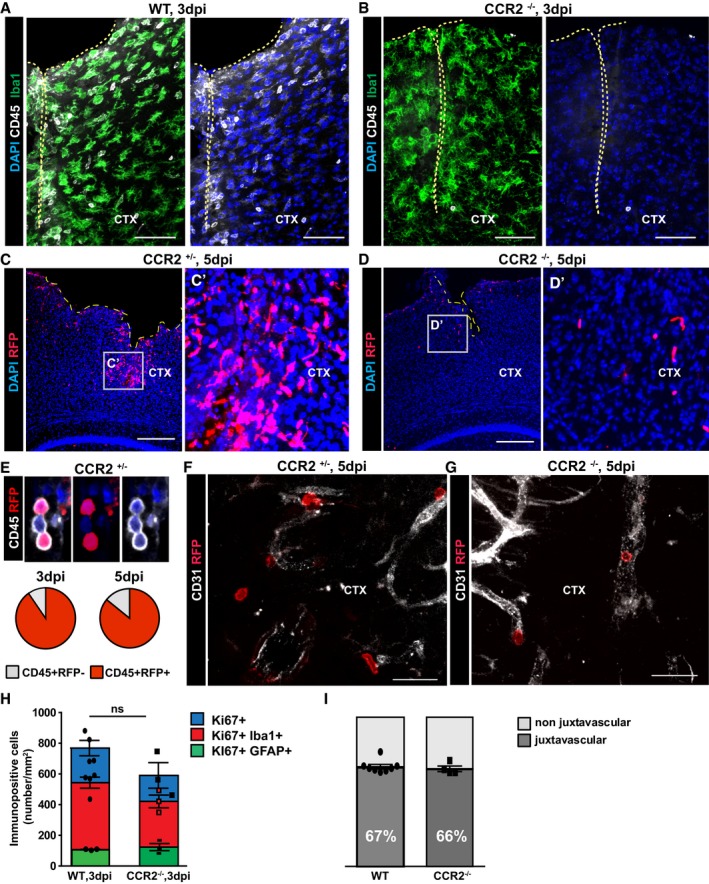
Confocal images of Iba1 and CD45 double‐immunostaining in WT (A) and CCR2−/− (B) mice at 3 dpi. The cell nuclei were counterstained with DAPI.
-
C, D
Overview of the lesioned cortex in heterozygous CCR2RFP/+ (C) and homozygous CCR2RFP/RFP (D) mice.
-
E
Confocal images of immune cell infiltrates at 5 dpi show co‐localization of RFP expression and CD45. Pie graphs display the proportion of CD45 cells that were also RFP+ at 3 and 5 dpi.
-
F, G
RFP expressing cells were detected in the parenchyma in heterozygous (F), but not in homozygous CCR2RFP/RFP mice where they remained inside blood vessels (G).
-
H, I
Histograms depicting the number of proliferating glial cells at 3 dpi (H) (ns, P = 0.2286 for all Ki67+ cells, n = 4 for WT and n = 3 for CCR2−/−; P = 0.1143 for Iba1+Ki67+, n = 4 WT, n = 3 CCR2−/−; P = 0.600 for GFAP+Ki67+, n = 3) and the proportion of juxtavascular proliferating astrocytes among all proliferating astrocytes at the injury site of WT and CCR2−/− mice at 5 dpi (I). All data (individual data points, i.e., animals, are indicated as dots or squares) are represented as mean ± SEM per independent experiments (n ≥ 3). Significance of differences between means was analyzed using Mann–Whitney test.
Data information: The dashed lines indicate the site of injury. Scale bars: 150 μm (C, D), 100 μm (A, B), 30 μm (F, G).

