Fig. 14.

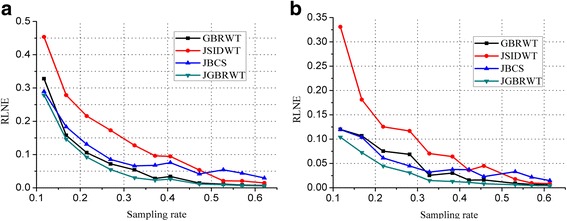
RLNEs evaluation at various sampling rates. a and b display the RLNEs with regard to the fully sampled data shown in Figs. 5(b) and (d) under Cartesian under-samplings

RLNEs evaluation at various sampling rates. a and b display the RLNEs with regard to the fully sampled data shown in Figs. 5(b) and (d) under Cartesian under-samplings