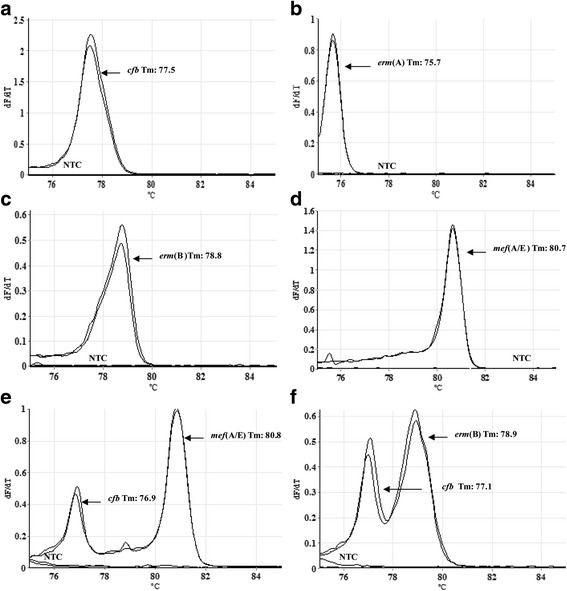
Fig. 2.

Melting curve analysis showing the melting temperature peaks (Tm) of Streptococcus agalactiae with macrolide and lincosamide resistance genes and negative template controls (NTC). a LMC UEL 65 (cfb); (b) LMC UEL 65 [erm(A)]; (c) LMC UEL 66 [erm(B)]; (d) LMC UEL 15 [mef(A/E)]; (e) LMC UEL 15 [cfb and mef(A/E)]; (f) LMC UEL 66 [cfb and erm(B)]
