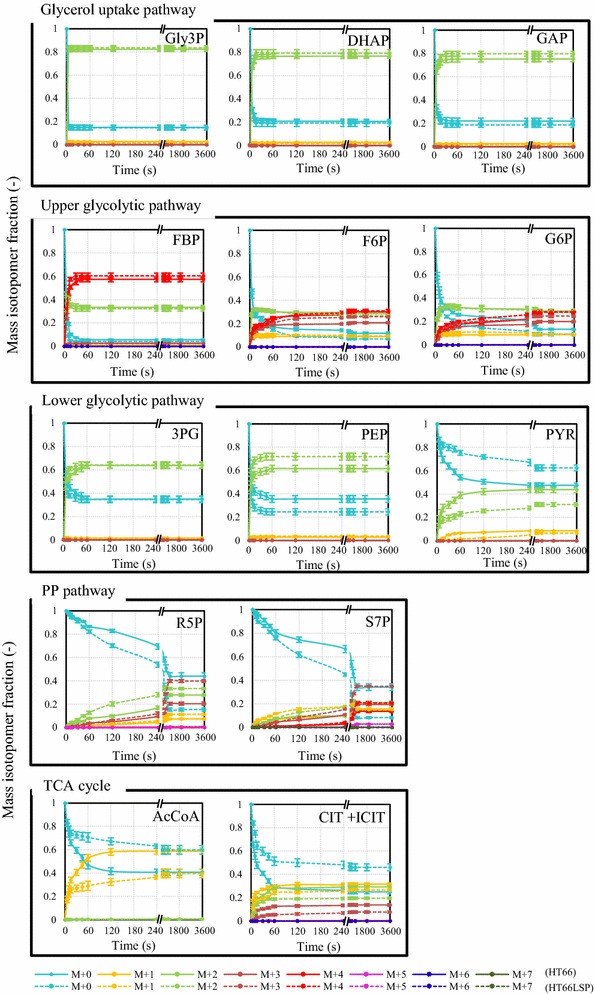
Fig. 5.

13C-labeling trajectories of selected intracellular metabolites after the introduction of [1,3-13C]glycerol at the exponential phase. Mass isotopomer data corrected for natural isotopic abundances are shown. The solid lines (HT66) and dashed lines (HT66LSP) illustrate the measured labeling trends
