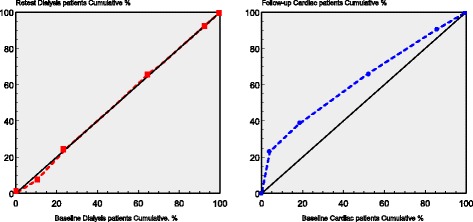
Fig. 1.

ROC-curve for dialysis patients and cardiac rehabilitation patients illustrating the change in the Health change item between the two measurements. The curves present the cumulative marginal distribution and show no differences for the dialysis patients, but an increase in patients with better health now than a year ago for the cardiac rehabilitation patients
