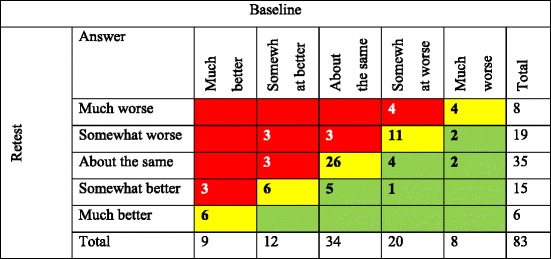
Table 4.
Test-retest reliability: Health change item ratings for dialysis patients at baseline and retest

The diagonal (yellow) represents patients who answered the same at baseline and retest (n = 53; PA = 64%), those who improved are shown below the diagonal (green) (n = 14, 17%) and those worsened are above the diagonal (red) (n = 16, 19%)
