FIGURE 3.

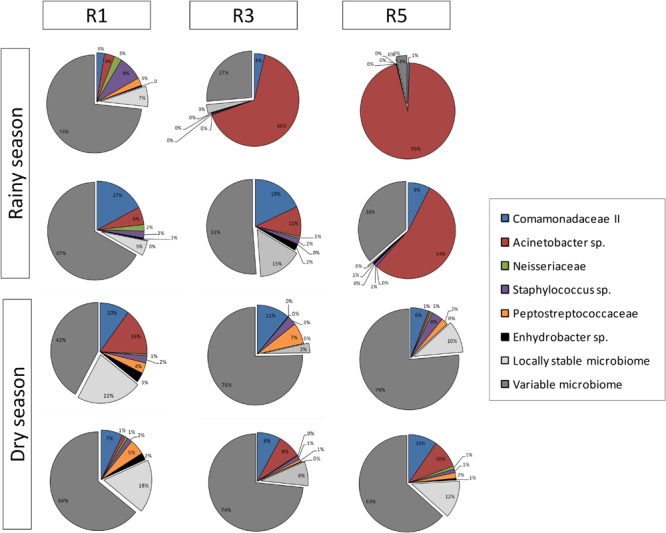
Overview of composition and relative abundance of M. hispida core bacteriome at different sampling locations (R1, R3, and R5) and over time (rainy and dry seasons) (n = 4).

Overview of composition and relative abundance of M. hispida core bacteriome at different sampling locations (R1, R3, and R5) and over time (rainy and dry seasons) (n = 4).