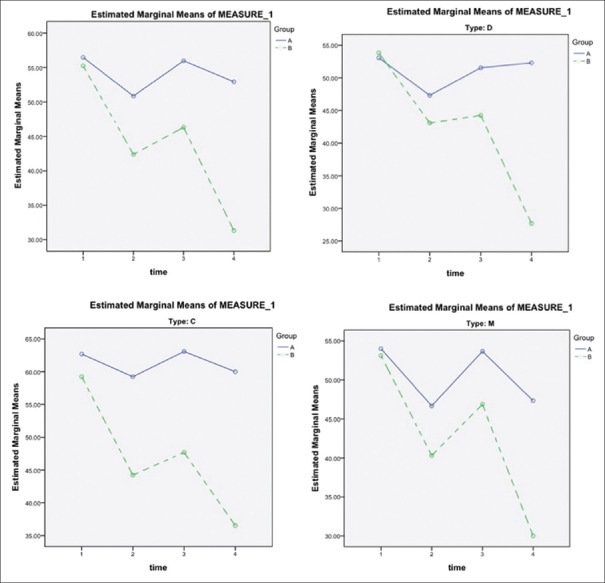
Figure 2.
The trends of changes in the severity of pain during the study among the intervention and control group. Group A: placebo group; Group B: intervention group. C = Constipation-dominant, D = Diarrhea-dominant, M = Mixed. Time 1: Assessed at baseline (day 0); Time 2: The 4th week (day 28) of treatment, 1st on-drug period; Time 3: The 8th week (day 56) of treatment, off-drug period; Time 4: the 12th week (day 84) of treatment, 2nd on-drug period

