Figure 12.
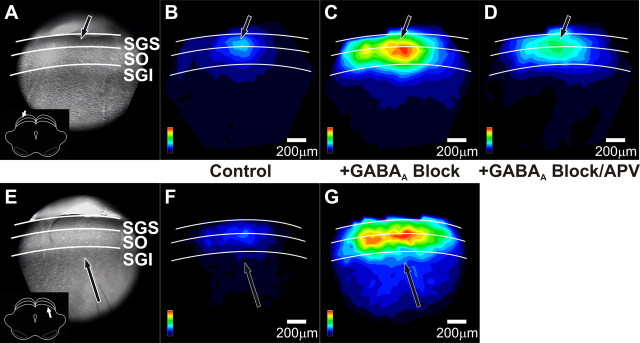
GABAA receptor blockers alter the spatial patterns of after-depolarizations in SC. A, CCD image of the SC slice preparation. The arrow indicates the point of stimulation and the inset shows orientation of the coronal slice (cortex removed). White lines and labels denote the layers of the SC. B, Color map image of the after-depolarization signal propagation following SGS stimulation before drug application, normalized to the maximum amplitude of the increased after-depolarization following GABAA receptor block. Hotter colors indicate higher amplitude signals. Color scales are in the lower right corner of each panel. Layers of the SC are demarked as in A. Scale bars, 200 μm. C, Color map image of the after-depolarization signal propagation following SGS stimulation after addition of 50 μm GABAA receptor blocker, normalized to the maximum amplitude of after-depolarization following GABAA receptor block. D, Color map image of the after-depolarization signal propagation following SGS stimulation after addition of 50 μm GABAA receptor blocker plus 50 μm APV, normalized to the maximum amplitude of the after-depolarization following GABAA receptor block. E–G, Same as A–C, respectively, following SGI stimulation.

