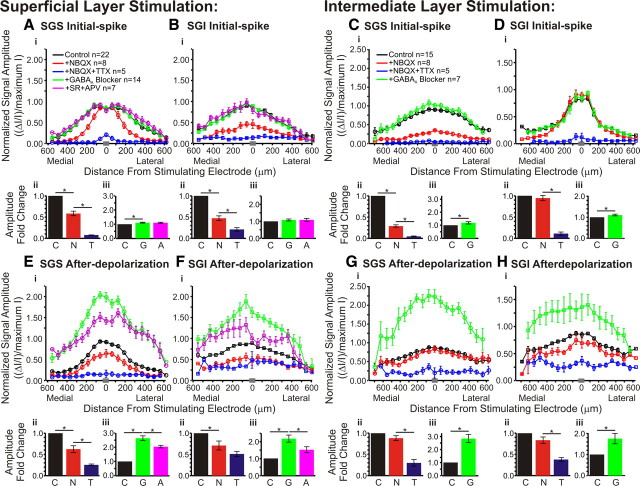
Figure 13.
Pharmacological influences on the mediolateral distribution of responses within the SC. Normalized signal amplitude is plotted against distance from the stimulating electrode. The data were normalized to the maximum amplitude of the control (predrug) signal. Data are plotted before drug application (black; SGS stim: N = 22; SGI stim: N = 15), after application of NBQX (red; SGS stimulus, N = 8; SGI stimulus, N = 8), after application of NBQX and TTX (blue; SGS stimulus, N = 5; SGI stimulus, N = 5), after application of GABAA receptor blocker (green; SGS stimulus, N = 14; SGI stimulus, N = 7), and after application of GABAA receptor blocker (SR) and APV (magenta; SGS stimulus, N = 7). For all the plots, data were binned to provide 20 location points. The gray bar in each panel on the x-axis indicates the bin in which the zero distance occurred. Ai, Initial-spike (0–10 ms) data within the SGS following SGS stimulation. Aii, Aiii, Bar graphs plotting the fold changes in signal amplitude across slices. Data for bar graphs come from all diodes within ±400 μm the stimulating electrode. Vertical lines represent SE. *p < 0.05. C, Control, no drug (black); N, NBQX (red); T, NBQX/TTX (blue); G, GABAA receptor blocker (green); A, APV (magenta). N = 5 for control/NBQX/TTX bar graphs; N = 7 for control/GABAA receptor blocker/APV bar graphs. B, Same as in A for the initial-spike in the SGI following SGS stimulation. C, Same as in A for the initial-spike in the SGS after SGI stimulation. Note that APV was not added in SGI stimulation experiments. D, Same as in C for the initial-spikes within the SGI following SGI stimulation. E–H, Same as in A–D for the after-depolarization (20–160 ms).

