Figure 14.

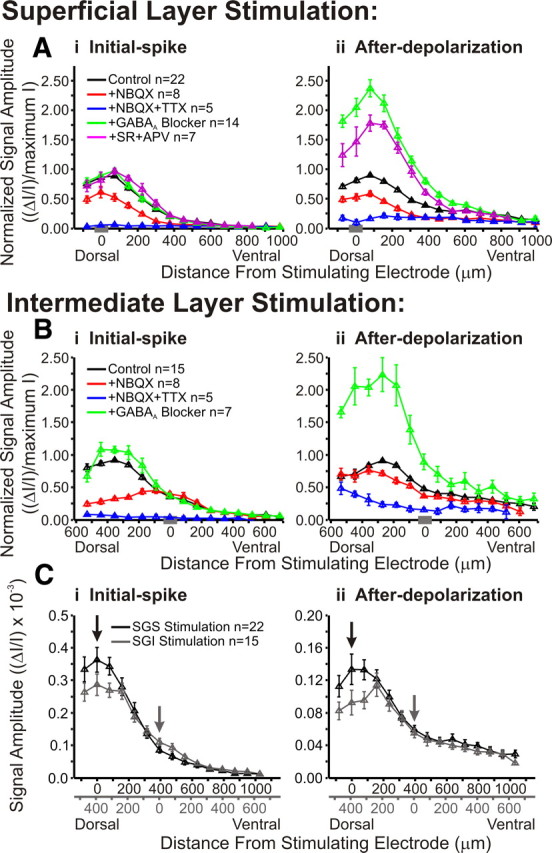
Pharmacological agents alter the dorsoventral distribution of responses within the SC. A, Normalized signal amplitude is plotted against dorsoventral distance from the stimulating electrode for initial-spike (i, 0–10 ms) and after-depolarization (ii, 20–160 ms) following SGS stimulation. Vertical lines represent SE. The data were normalized to the maximum amplitude of control (predrug) signal. Data are plotted for control (black; SGS stimulus, N = 22; SGI stimulus, N = 15), after addition of NBQX (red; SGS stimulus, N = 8; SGI stimulus, N = 8), after addition of NBQX and TTX (blue; SGS stimulus, N = 5; SGI stimulus, N = 5), after application of GABAA receptor blocker (green; SGS stimulus, N = 14; SGI stimulus, N = 7), and after application of GABAA receptor blocker (SR) and APV (magenta; SGS stimulus, N = 7). The data were binned to provide 15 location points. The gray bar on the x-axis in each panel indicates the zero distance bin. B, Same as in A following SGI stimulation. Note that APV was not applied in SGI stimulation experiments. C, Comparison of non-normalized signal amplitude (ΔI/I) from SGS stimulation (black, N = 22) and SGI stimulation (gray, N = 15) for initial-spike (i) and after-depolarization (ii). Data were binned into 18 discrete location points. Arrows indicate the zero distance bins for each type of stimulation. Duel x-axes are shown with the relative distances from stimulating electrode.
