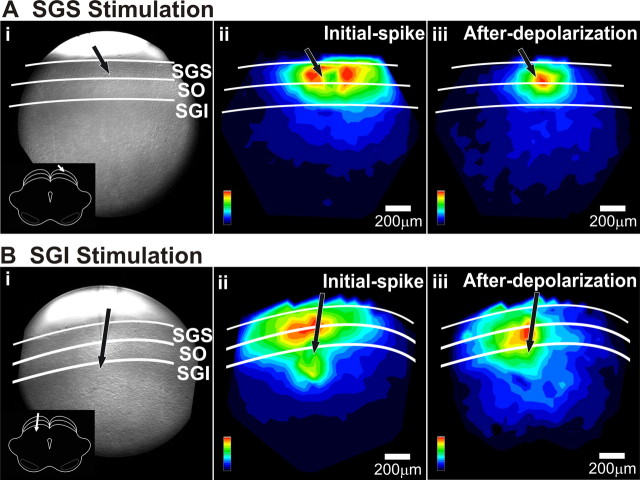
Figure 3.
Signal pattern depends on the site of stimulation. A, Mapped responses to superficial layer (SGS) stimulation. i, CCD image of the SC slice preparation. White lines and labels denote laminae. Inset, Schematic of the coronal slice (cortex removed) and placement of the stimulating electrode. ii, Color map image of the initial-spike signal amplitude following SGS stimulation. The amplitudes were normalized to the maximum amplitude of the initial-spike component (0–10 ms). iii, Color map image of the after-depolarization signal intensity following SGS stimulation. This map was normalized to the maximum amplitude of the after-depolarization component (20–160 ms). Scale bars, 200 μm. Black arrows indicate the points of stimulation. B, Mapped responses to intermediate layer (SGI) stimulation. i–iii, Same as in A.

