Figure 6.
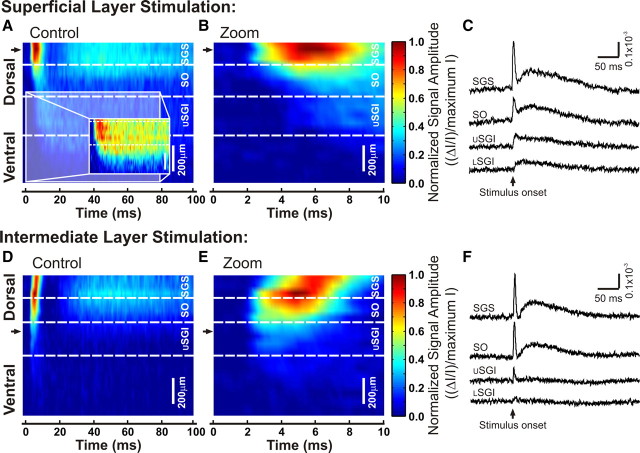
A single pulse of stimulation evokes a response that spreads widely between the layers of the SC. A, B, D, E, Three-dimensional color maps show the time course of response spread following electrical stimulation. The dorsoventral location along a selected path in the SC is shown on the y-axis. Black arrows show the sites of stimulation. Scale bars, 200 μm. Time is shown on the x-axis from 0 to 100 ms after stimulation. Signal intensity is normalized to the maximum of all diodes on the selected path. Hotter colors indicate higher signal amplitude. Dotted white lines demark approximate boundaries of the labeled laminae. USGI, Upper SGI; LSGI, lower SGI. A, Optical responses to stimulation in SGS. Inset, Selected time frame (0–80 ms) renormalized to the maximum intensity within the selected dorsoventral region to show the spread of activity into the SGI. B, An expanded view of A, showing 0–10 ms. C, Representative traces selected from each lamina along the dorsoventral path. The upward arrow indicates the time of stimulation and the responses are shown as ΔI/I. D, Three-dimensional color map as in A for SGI stimulation. E, F, Same as B and C, respectively, for SGI stimulation.

