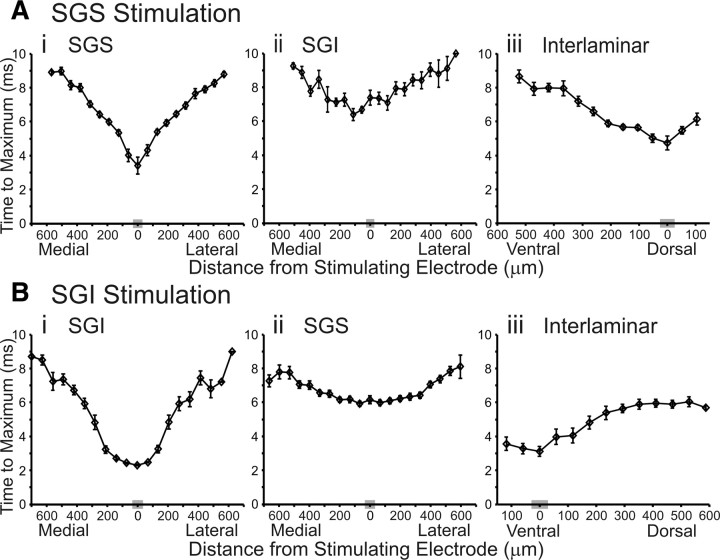
Figure 7.
Plots of latency versus distance. A, B, Time to maximum response amplitude is plotted against the mediolateral or dorsoventral distance from the stimulation site. Mediolateral diodes are binned (based on distance) into 20 discrete points and dorsoventral data are binned into 13 discrete points, with each point representing the mean of diodes within that bin. The gray box on the x-axis is the bin containing diodes closest to the axis of stimulation (zero distance). The vertical lines through the points indicate SE. A, Latency plots following SGS stimulation (N = 15). i, Mediolateral plot of SGS responses. ii, Mediolateral plot of SGI responses. iii, Dorsoventral plot. B, Latency plots following SGI stimulation (N = 15). i, Mediolateral plot of SGI responses. ii, Mediolateral plot of SGS responses. iii, Dorsoventral plot.

